Long on USD/JPY at the 100 SMA
In the midday forex brief, I highlighted USD/JPY. This forex pair has been losing ground today in a straight decline without any pullbacks.
In the midday forex brief, I highlighted USD/JPY. This forex pair has been losing ground today in a straight decline without any pullback higher. But, the bigger chart setup looks bullish so we just went long on this pair. We are not counter trading, although that can be profitable too if you know how to do it properly.
As you can see from the H1 chart below, USD/JPY has been declining today but the trend is bullish. The price has fallen to the 100 smooth moving average (red) but it’s obvious that the buyers are in waiting in big numbers at that moving average.
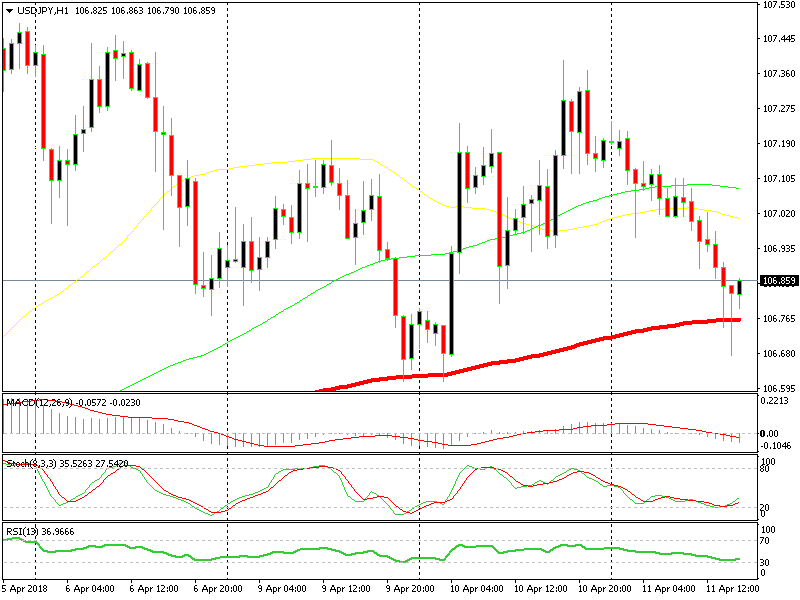
The 100 SMA is doing a good job here
The previous hourly candlestick is another bullish signal. It closed as a pin which is a reversing indicator. The stochastic indicator is also oversold, so the retrace is complete on this timeframe chart.
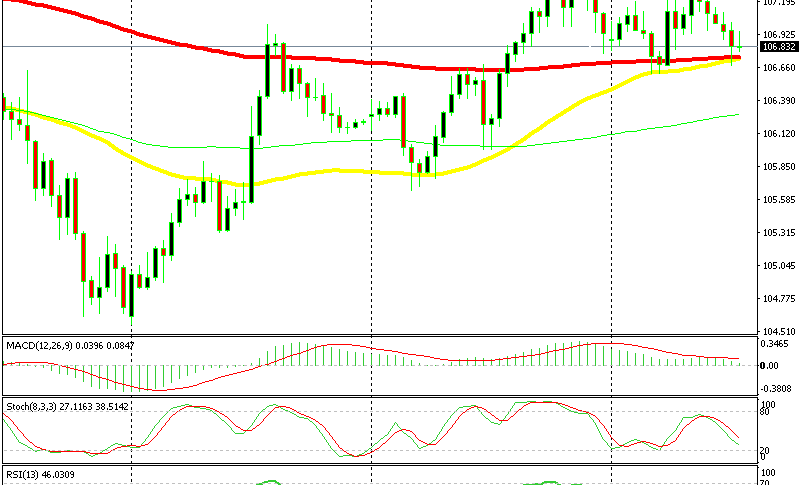
Switching to the H4 chart, we see that the same moving average is standing in the same area providing support. Besides that, we have the 50 SMA at the same levels which has just caught up.
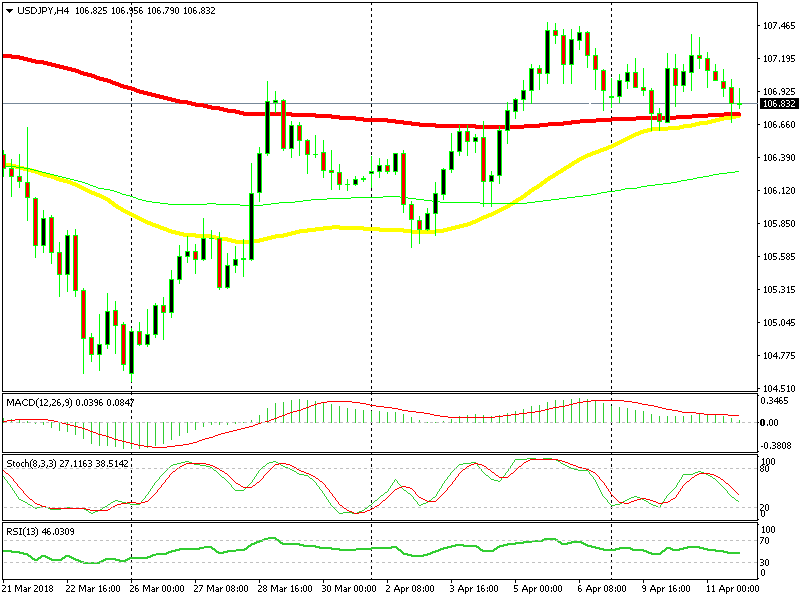
On this chart, we have two moving averages providing support
This moving average has provided support several times before in the previous few weeks. The stochastic indicator is not oversold yet on this timeframe, but it is close to those levels so the retrace is almost complete on this timeframe too. Now, the price is starting to move up too, so this signal looks good.
- Check out our free forex signals
- Follow the top economic events on FX Leaders economic calendar
- Trade better, discover more Forex Trading Strategies
- Open a FREE Trading Account