EUR/USD Forms A Bearish Setup on the Daily Chart
This week has been pretty bullish for EUR/USD. In fact, the bullish momentum started on Friday last week after this pair failed to break...
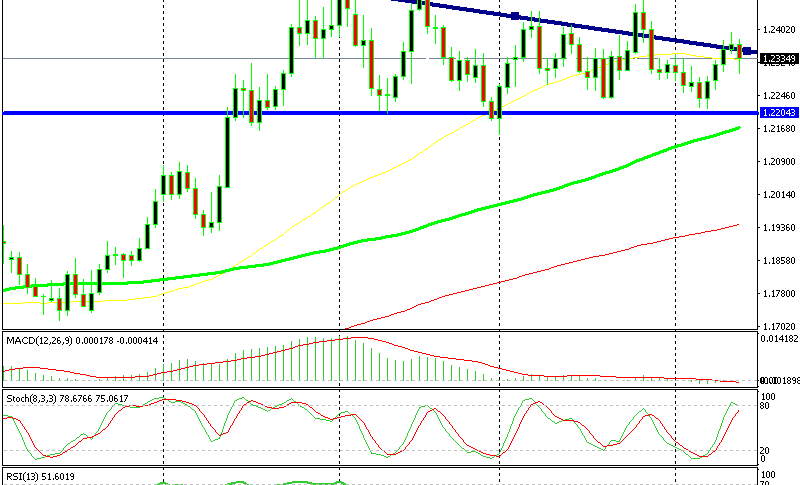
This week has been pretty bullish for EUR/USD. In fact, the bullish momentum started on Friday last week after this pair failed to break the support around 1.22. That level has been a tough nut to crack. The sellers have tried to break it multiple times but they have given up right there.
It has been a bullish run since last Friday. The price reached 1.2396 yesterday and reversed just below 1.24. it formed as an upside-down pin. The pin is a reversing signal and so far today, it looks like a reverse is taking place.
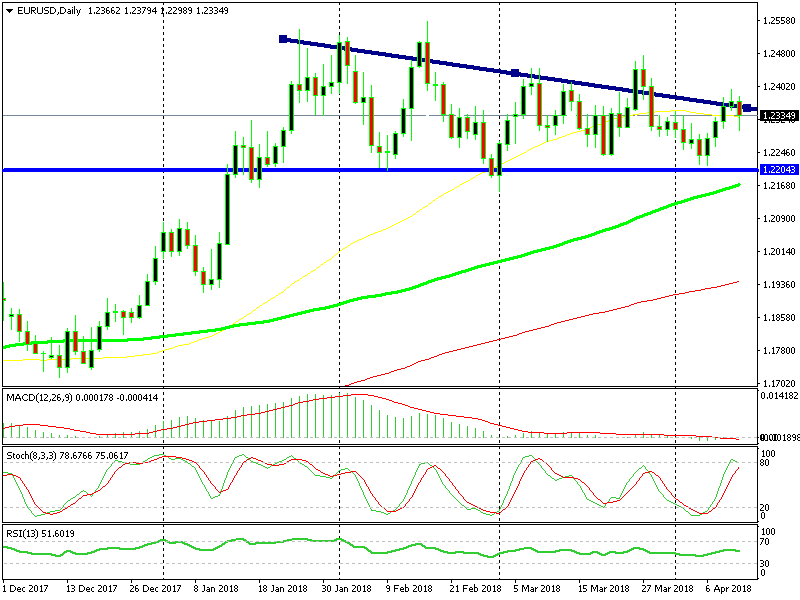
Yesterday’s pin is a strong bearish signal
Today, EUR/USD has been sliding all day and the meeting minutes from the ECB (European Central Bank) earlier today didn’t help this pair. Instead, the minutes accelerated the slide.
Now, the daily candlestick looks really bearish. The stochastic indicator is overbought and it is turning down. This means that the bullish move is complete and now it’s time for the sellers to take their turn. This has been the story of the last few months, buyers become active at resistance near 1.22, sellers become active at 1.24 or above.
We missed the chance to sell near the top. I didn’t see the daily candlestick this morning, otherwise I would have gone short. This range has been really obvious so it is easy to make some pips as EUR/USD moves up and down. We missed the chance today, but that’s the trading range if you want to trade it.
- Check out our free forex signals
- Follow the top economic events on FX Leaders economic calendar
- Trade better, discover more Forex Trading Strategies
- Open a FREE Trading Account
- Read our latest reviews on: Avatrade, Exness, HFM and XM
Related Articles

Sidebar rates
Related Posts
