Trading the Bearish Chart Setup in USD/CAD
A short while ago, we opened a forex signal in USD/CAD. The chart setup in this forex pair is looking increasingly bearish so we decided...
A short while ago, we opened a forex signal in USD/CAD. The chart setup in this forex pair is looking increasingly bearish so we decided to try our luck on this pair after having a winning sell signal earlier on this week.
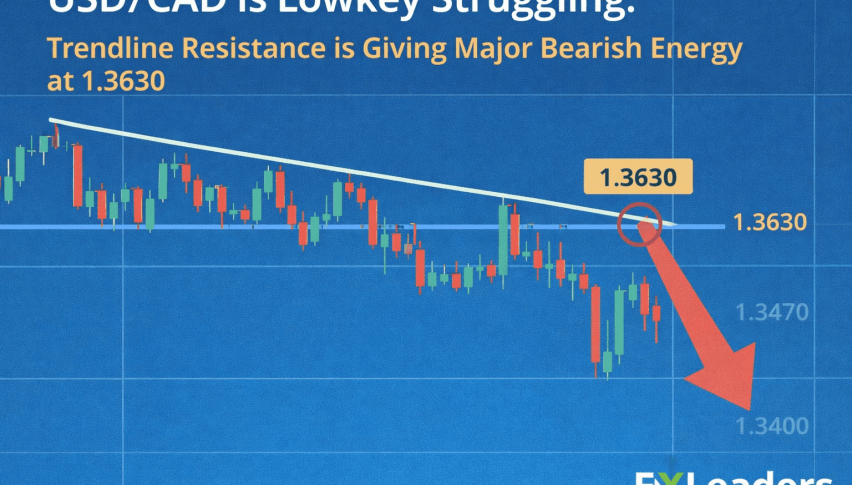
USD/CAD has been trading on a bearish trend for about four weeks. This week, the downtrend has picked up more pace. USD/CAD has lost nearly 300 pips from top to bottom. The buyers haven’t been able to even get their act together, so this is the main bearish signal for me.
You know that I like moving averages, especially the round ones which are the 20 SMA, 50 SMA, 100 SMA and 200 SMA. These are big round numbers so all forex traders use them, therefore they are likely to work better than the vast part of technical indicators.
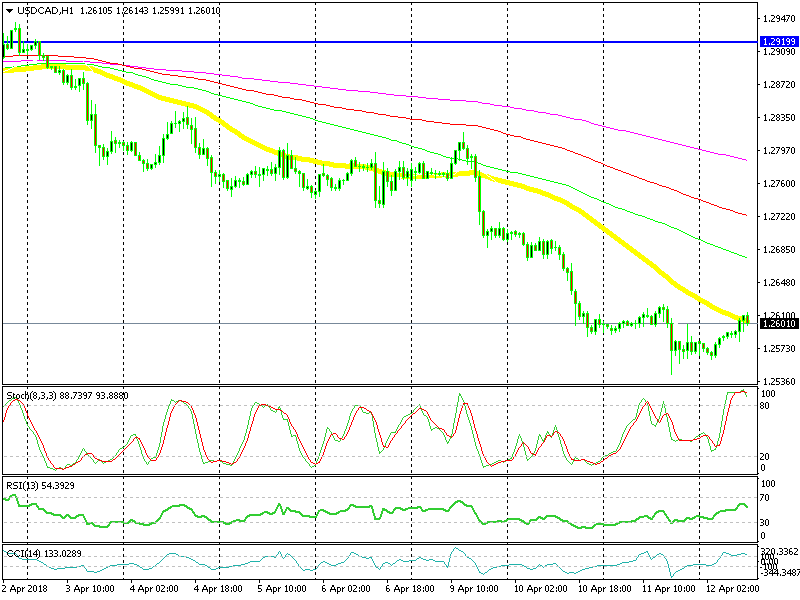
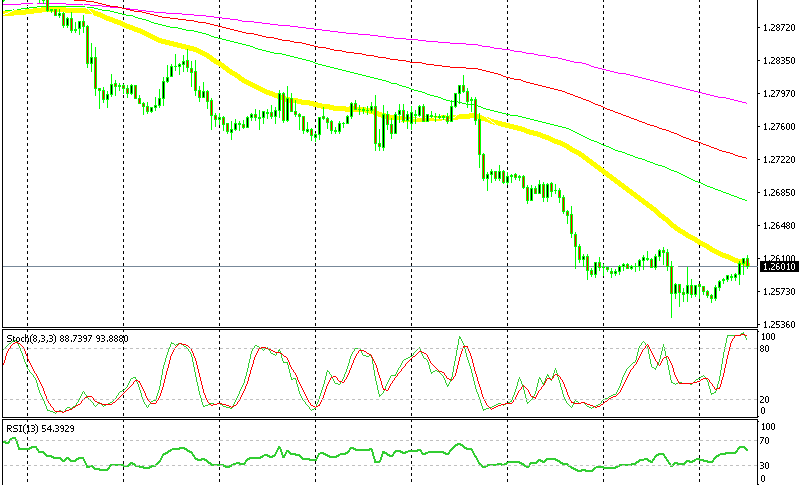
The 50 SMA should reverse the price back down now
The buyers have pushed higher overnight and the price has retraced up to the 50 SMA (Yellow) on the H1 chart. The buyers are having trouble pushing above it at the moment, so this moving average is providing resistance.
The stochastic indicator is overbought as well on this timeframe chart. This means that the retrace up is complete and the downtrend should resume soon. The H4 chart is becoming overbought as well. We opened this signal just below the 50 SMA, now let’s give this pair the time it needs to do its thing.
- Check out our free forex signals
- Follow the top economic events on FX Leaders economic calendar
- Trade better, discover more Forex Trading Strategies
- Open a FREE Trading Account
- Read our latest reviews on: Avatrade, Exness, HFM and XM
Related Articles


Sidebar rates
Related Posts
