GBP/USD Forming A Bullish Reversal Pattern on the H1 Chart
Yesterday was a great day for GBP/USD. In fact, it has been a great month so far as GBP/USD accelerates higher.

Yesterday was a great day for GBP/USD. In fact, it has been a great month so far as GBP/USD accelerates higher. This pair has been in a strong uptrend for more than a year, but this month the uptrend is picking up pace.
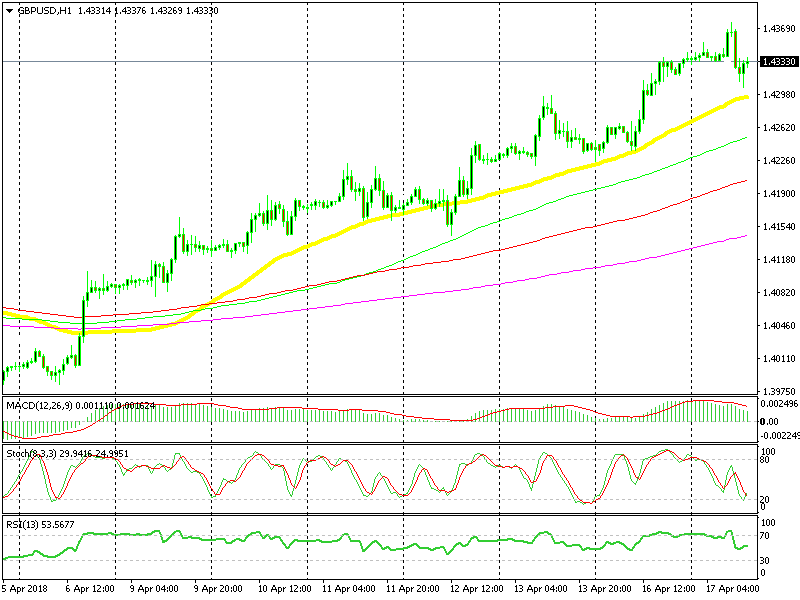
At the beginning of this month, GBP/USD dived below 1.40, but the 50 SMA (yellow) held the ground well and reversed the price back up. The main reason for the latest rally in this pair has been the idea of a soft Brexit which is becoming reality day by day. A soft Brexit meant that there won’t be major interruptions to normal life between the UK and the EU, so investors are a bit released, hence the rally.
Today, the price reached 1.4370s in the morning, but in the last few hours we have seen this pair make a pullback lower. This is a retrace which is normal during an uptrend.
The reverse happening to the upside is already
From the hourly chart above, we see that the price got close to the 50 SMA (yellow) but it is starting to reverse now, which means that this moving average is providing support. It has provided support for more than a week, so forex traders are watching it and the buyers are counting on it to do the same job for as long as the uptrend continues.
The previous hourly candlestick has formed a hammer which is a reversing signal. So, it seems as the retrace down is almost complete and now the uptrend is resuming. We might go long here or wait for a better entry price lower.
- Check out our free forex signals
- Follow the top economic events on FX Leaders economic calendar
- Trade better, discover more Forex Trading Strategies
- Open a FREE Trading Account