WTI Crude Oil – Two Things to Know Before Trading Crude Oil
For the past week, Crude Oil has been consolidating in a very tight range, from $66 - $67.50. This seems to be due to...

For the past week, Crude Oil has been consolidating in a very tight range, from $66 – $67.50. IThis seems to be due to investors’ uncertainty. The strikes on Syria and ongoing geopolitical tensions are keeping the crude oil supported, while the glut of supplies is making it weaker. In this particular situation, we need to follow the technical indicators.
WTI Crude Oil – Technical Outlook
1) Triple Bottom Support
On the 3 – hour chart, the WTI is forming a triple bottom at $66. Crude Oil has remained supported above this level during the previous week. Typically, the triple bottom levels cause a reversal in prices. So, if WTI manages to break downward, we can expect $65.15 level on the board soon.
2) Oversold RSI & Stochastics
Secondly, the leading indicators are holding in the oversold zone since last week. Technically, we should expect a bounce back in the Oil. Nevertheless, we should be ready for a bearish breakout. Zooming out to the 3 – hour chart, the Oil has also formed a descending triangle pattern. This particular pattern is famous for a bearish breakout.
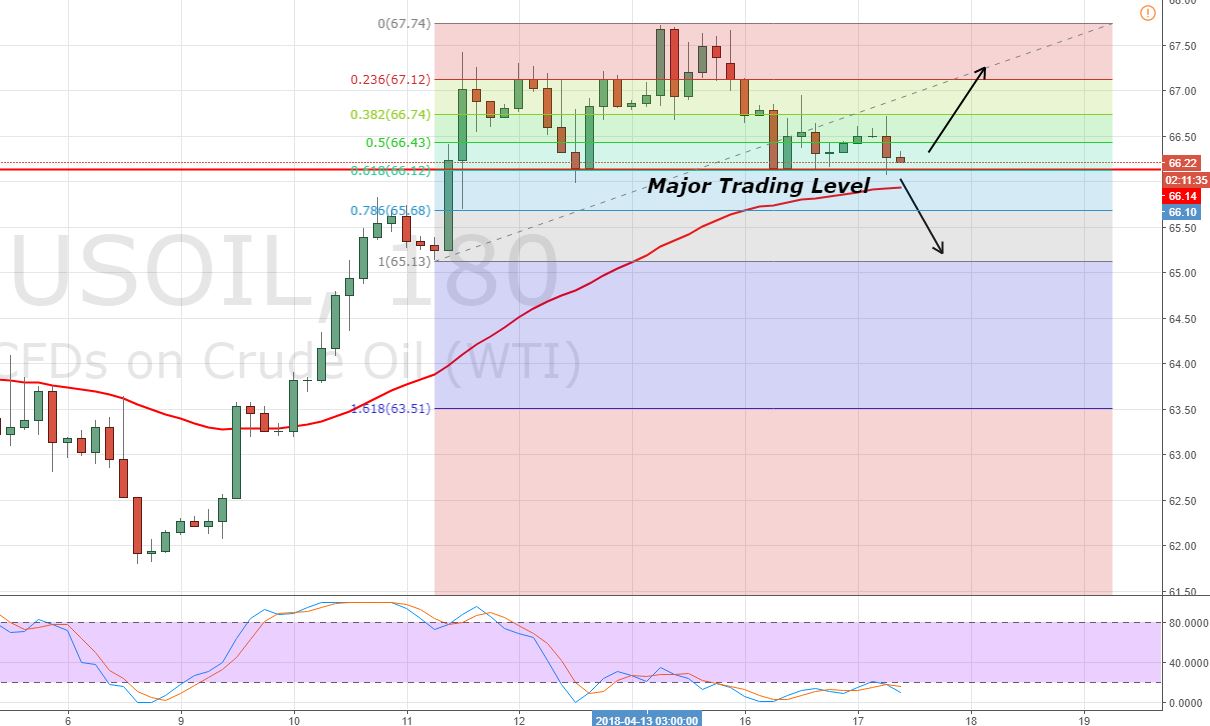
WTI Crude Oil – 3 Hour Chart
WTI Crude Oil – Trading Plan
Keeping it simple, I will be looking to stay bearish below $66, to target $65.15. Whereas, above $66, the market can bounce off to $66.75. Stay tuned!
- Check out our free forex signals
- Follow the top economic events on FX Leaders economic calendar
- Trade better, discover more Forex Trading Strategies
- Open a FREE Trading Account


