AUD/USD Reverses and Turns Bullish at the 50 SMA
Yesterday we opened a forex signal in AUD/USD which is still live. This pair turned bullish last week together with other commodity...

Yesterday we opened a forex signal in AUD/USD which is still live. This pair turned bullish last week together with other commodity currencies and climbed more than 150 pips during that time.
Yesterday, AUD/USD was retracing down and I decided to go long based on the hourly timeframe chart. The price was finding support on the 100 SMA on that timeframe and stochastic was oversold, which meant that the retrace down was complete.
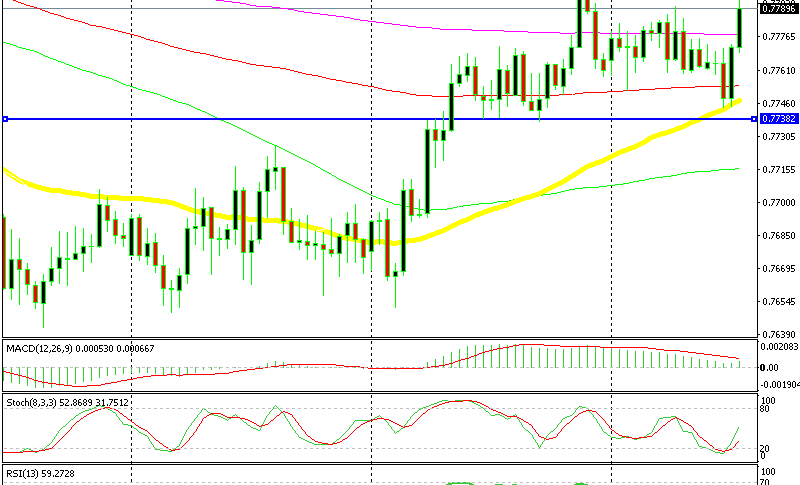
But the sellers decided to give the downside another try and they pushed lower early this morning. Perhaps, the negative MI leading index from Australia this morning was the reason. Whatever the reason for that dip, the sellers gave up right at the 50 SMA (yellow) on the H4 chart.

Right now, the H4 chart setup looks pretty bullish
The price touched that moving average and reversed back up. The stochastic indicator also became oversold at the same time, so that was a perfect chart setup for buyers. We had bought before, therefore we decided to stay out.
Now, AUD/USD is 10 pips above our entry point so it is looking good. The stochastic indicator is heading up with plenty of space to run, so we are holding on to this signal, hopefully this pair reaches the take profit target today.
- Check out our free forex signals
- Follow the top economic events on FX Leaders economic calendar
- Trade better, discover more Forex Trading Strategies
- Open a FREE Trading Account


