Gold Soars as Bullish Gartley Pattern Under Way
Looking at the hourly chart of Gold, you can see a harmonic pattern. In particular, it's a bullish Gartley pattern which has already...
Howdy, traders.
The precious metal continues to trade sideways in the absence of top-tier catalysts from the US economy. Gold traded exactly in line with our forecast Quick Profit In Gold – Traders Await Triangle Breakout. Today, investors focus is still on the Loonie, as the BOC is due to release its overnight rate. However, I just spotted a really cool setup on Gold. Watch out…
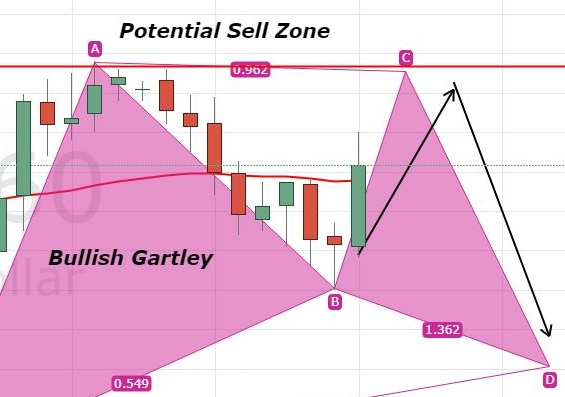
GOLD – XAU/USD – Bullish Gartley Pattern
Looking at the hourly chart of Gold, you can see a harmonic pattern. In particular, it’s a bullish Gartley pattern which has already completed its XA & AB wave at $1,341.
For the moment, Gold is likely to continue trading bullish to complete its B to C wave near $1,347. As per the Gartley pattern, the yellow metal is expected to take a U-turn below $1,347/48 zone to complete the C to D wave at $1,340.

Gold – Hourly Chart – Technical Setup
The lagging indicator, 50-periods EMA is providing a solid resistance to Gold near $1,345 but the RSI is signaling a potential for a bullish reversal. On the breakout above $1,348, the Gold may go after $1,353.
Gold – XAU/USD – Trading Plan
I will be looking to take selling positions below $1,348 to target $1,341. Whereas, buying will be preferred above $1,348. Good luck!
- Check out our free forex signals
- Follow the top economic events on FX Leaders economic calendar
- Trade better, discover more Forex Trading Strategies
- Open a FREE Trading Account


