Seeking Cover Behind the 50 SMA on EUR/CHF
Last Thursday we opened a buy forex signal in EUR/CHF. This pair has been on a solid uptrend but is forcing us to pull back below the 50 SMA

Last Thursday we opened a buy forex signal in EUR/CHF. This forex pair has been on a solid uptrend for about a year. It kept breaking level after level without many pullbacks lower. The only decent pullback was earlier this year when EUR/CHF retraced 400 pips lower.
After that retrace, the bulls became active again and the solid uptrend resumed again. This pair got pretty close to the major level at 1.20 last Thursday. This point was the line in the sand for the Swiss National Bank (SNB) until January 2015 when it was removed quickly killing the forex market.
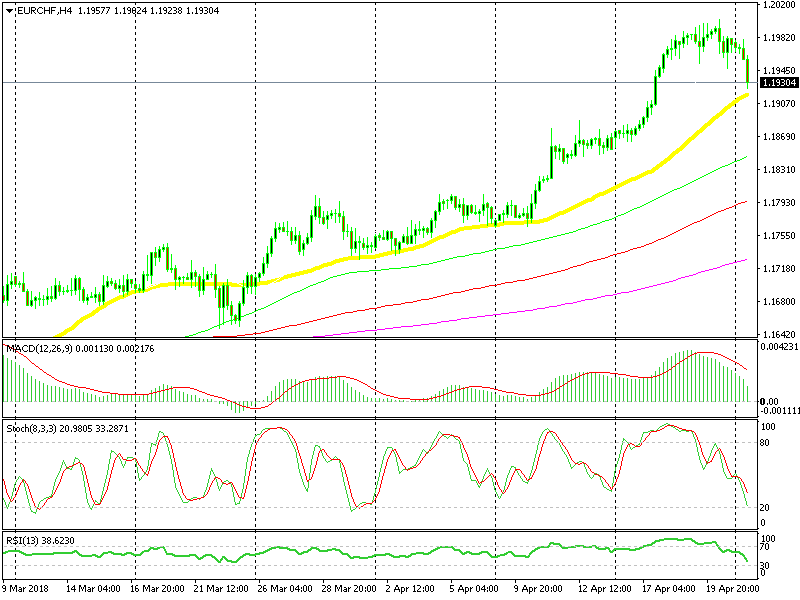
That same day, this pair started retracing lower and we decided to go long at the 50 SMA (yellow) on the hourly chart. That timeframe chart became oversold and the 50 SMA was holding on, at first. But, EUR/CHF traders were looking at the H4 chart apparently and the pullback stretched further below it.

We’re counting on the 50 SMA now
The pullback continued on Friday and is continuing today. Initially, we placed the stop for this forex signal at 1.1933 but decided to move it lower a while ago.
As you can see from the chart above, the 50 SMA (yellow) has been a solid support, particularly over the last two months. The sellers have managed to push the price below this moving average only once during this time and even then, they couldn’t push very far.
This moving average is a solid support indicator and we decided to take cover behind it. We pilled our SL target below that moving average, which now stands at 1.1915. Hopefully, this moving average will do its job again so our forex signal survives.
- Check out our free forex signals
- Follow the top economic events on FX Leaders economic calendar
- Trade better, discover more Forex Trading Strategies
- Open a FREE Trading Account


