The 50-SMA Is Still Saving Our Behinds on the EUR/CHF
Yesterday we posted a forex update about EUR/CHF. We opened a buy forex signal in this pair last week, but it has been giving us a hard time
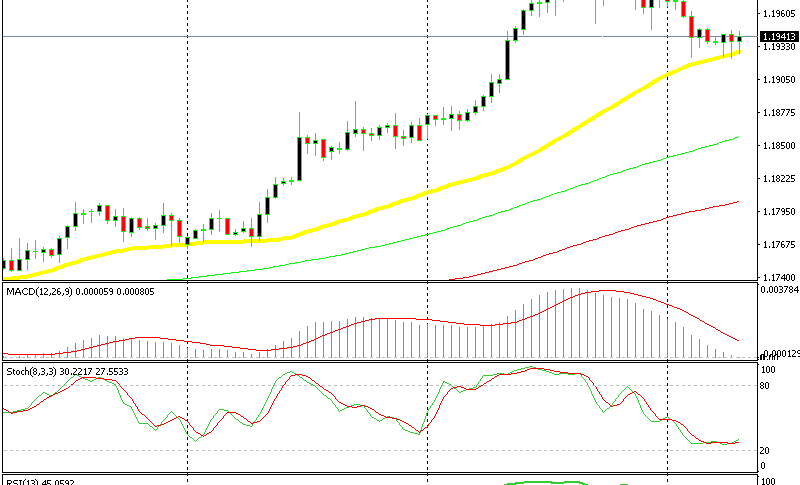
Yesterday we posted a forex update on the EUR/CHF. We opened a buy forex signal on this pair last week, but it has been giving us a hard time. We opened it as it was retracing lower from 1.20. It was finding support at the 50-SMA (yellow) on the H1 chart, but that moving average gave way eventually.
It continued to slip lower yesterday and we were forced to move the stop loss below the 50-SMA on the H4 chart and below the 100 on the H1 chart. We usually stick to our initial plan, but sometimes it is wise to nurse your trades by moving the SL and TP.
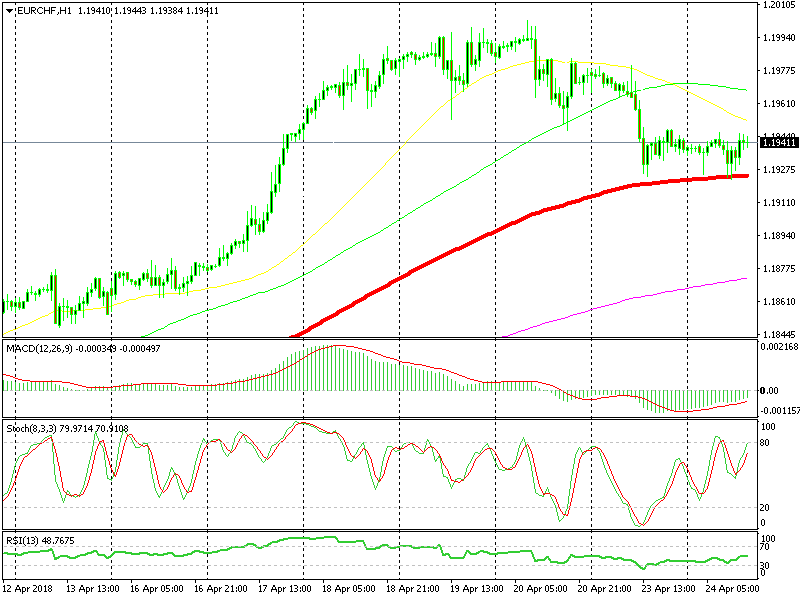
The 100-SMA has been providing solid support
We thought that these two moving averages on these two different timeframe charts would hold the decline and they did actually. So, that was a clever move and clever is all we can do in this business, we can’t force anything here, we’re too small to move the markets.
The H1 chart above is sort of overbought, but the H4 chart is oversold and it is turning higher. So, the H4 chart looks sort of hawkish. Another hawkish sign here are the last two H4 candlesticks. They look like two hammers which are reversing signals.
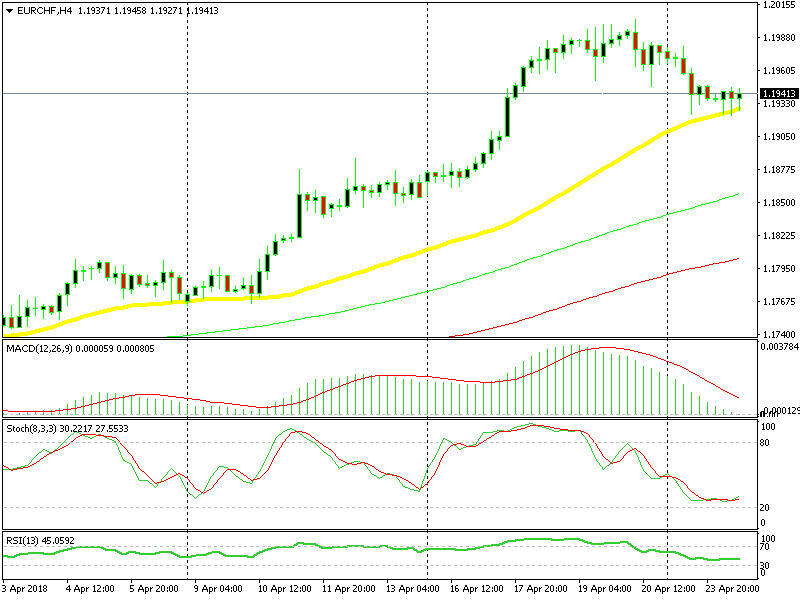
The 50-SMA on the H4 chart comes at the same levels as the 100-SMA on the H1 chart
Now, it seems as if the uptrend will resume soon and the next leg will take us higher. We hope that happens. Although, if this signal succeeds we will have to thank the 50-SMA which gave us a helping hand.
- Check out our free forex signals
- Follow the top economic events on FX Leaders economic calendar
- Trade better, discover more Forex Trading Strategies
- Open a FREE Trading Account
