Forex Signals US Session Brief April 26 – Yields Can’t Help the USD Anymore
The US Dollar has enjoyed some great times this week. The bond yields have helped its cause but they can't anymore.

The U.S. dollar has enjoyed some great times this week. I’d say this has been one of the best weeks since January 2017 and most of it was an attribute to the rising U.S. yields. However, yields have done their part now so the USD bulls should find other reasons to buy the Buck now.
Is This the End of the Bullish Run for the USD?
The U.S. dollar has made some decent gains in the last week or so. The EUR/USD was trading around 1.24 about a week ago, while now it is trading at 1.2180s. So, the support level at 1.22 has been broken. This level should turn into resistance now and I would suggest it as a place to look for short positions on this pair, but the European Central Bank meeting is underway, which might spoil the charts.
The 10-year treasury yields have been rising recently which has helped the USD cause, pushing it higher without any decent retrace during this period. When U.S. Treasury yields rise, investors start buying them instead of other bonds since the return on investment (ROI) increases. So, the cash gets transferred into the USD and as a result, the Buck moves higher. This is what we have seen this week.
The 10-year treasuries have risen from around 2.80% to above 3%, although they have retreated back below 3% now. I don’t expect them to continue much higher now so the U.S. dollar will have to find another reason to keep the uptrend going.
Bitcoin Finds Support After A Bearish Day
Yesterday was a really bad day for cryptocurrencies. They had been on a bullish run for more than two weeks which seemed like the beginning of an uptrend after trending down for three months. But, as you can see from the H4 bitcoin chart, this crypto closed yesterday with considerable losses.
We highlighted the 100-smooth moving average on the daily chart yesterday. That moving average is holding on pretty well. It has formerly acted as resistance and it looks like it has turned into support now.
The picture on the H4 chart, though, still looks bullish. On this timeframe, it is the 200-SMA (purple) which is providing support. It has rejected the price twice today and now it seems like bitcoin is reversing up. The stochastic indicator is oversold and turning north at the moment.
Besides that, the previous H4 candlestick has formed a doji, which is a reversing signal. So, the picture on this timeframe chart looks increasingly bullish now.
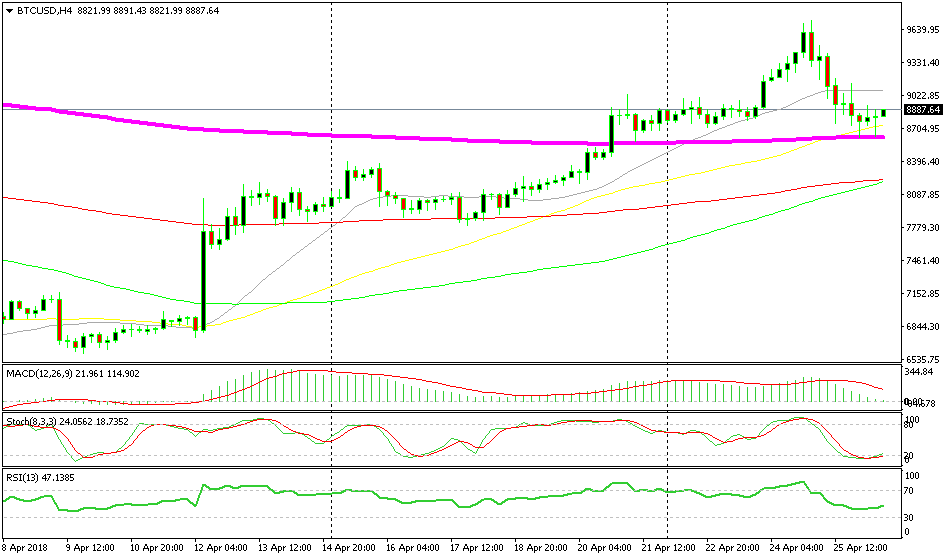
The 200-SMA is doing a great job providing support
Trades in Sight
Bearish NZD/USD
- The trend is strongly bearish.
- The retrace up is complete.
- The 50-SMA (yellow) is providing resistance.
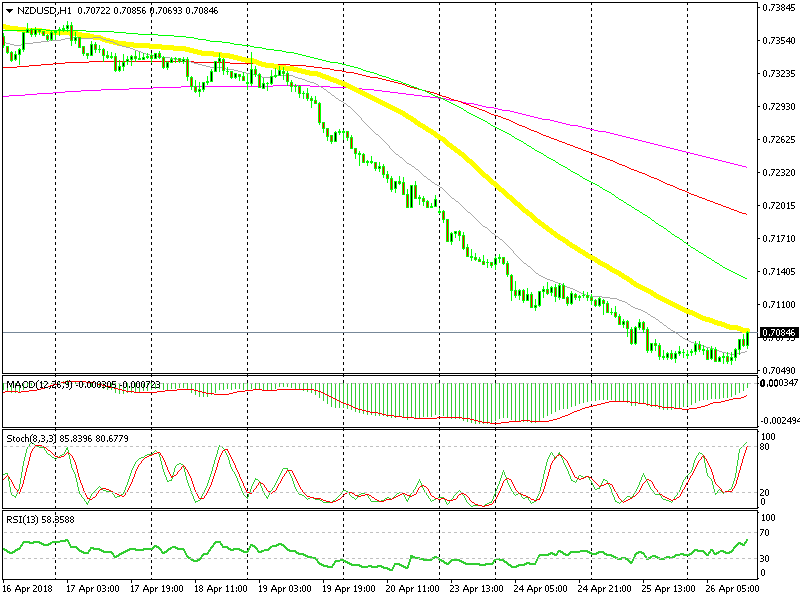
You can’t go against such a strong downtrend
The NZD/USD has been on a really strong bearish trend for quite some time and this week the downtrend has picked up considerable pace. Today, though, the price is retracing higher but the stochastic is overbought now and the 50-SMA is providing resistance. Should we go short right now?
In Conclusion
The round of U.S. economic data has been released. It looks good at first glance apart from core durable goods orders. Mario Draghi is holding his speech at the ECB headquarters, so there’s plenty going on at the moment. Let’s wrap up this midday brief here and get on with trading.
- Check out our free forex signals
- Follow the top economic events on FX Leaders economic calendar
- Trade better, discover more Forex Trading Strategies
- Open a FREE Trading Account