Oil Spills, USD/CAD Finally Out of the Range and Heading for 1.30
Last night, I was looking at USD/CAD and saw a range that this pair had formed. USD/CAD made a recovery in April and it formed a range
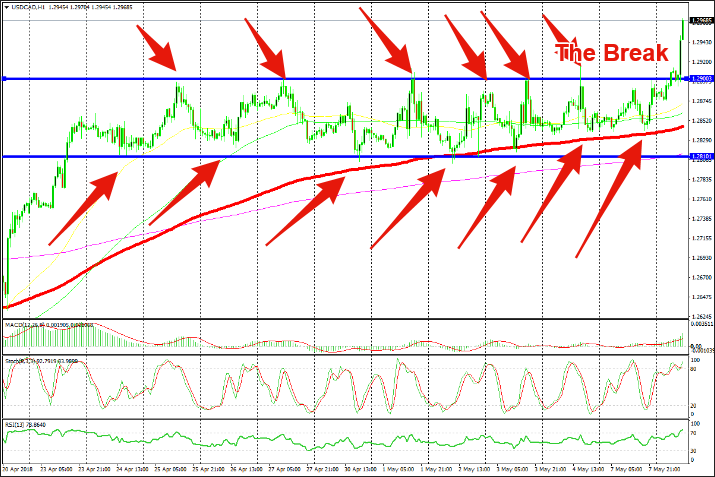
Last night, I was looking at USD/CAD and saw a range that this pair had formed. USD/CAD made an impressive recovery from 1.20 in mid-April, but the climb stopped by the end of the month and in the last two weeks this pair has consolidated on a 100 pips range.
As you can see from the hourly chart, USD/CAD started trading between 1.28 and 1.29 two weeks ago on Monday. Since then, it has respected the range perfectly. The bottom of the range was defining the downside in the first week but then the 100 SMA (red) took over that job.
Do you see how moving averages work? They take over from range or trend lines because the lines are static while the moving averages are, well, moving. They move and follow the price, providing support and resistance, no matter the price action, so they are great technical indicators.
If you switch to the H4 chart or the daily chart you can see that it is the 50 SMA (yellow) which stands at the same level as the 100 SMA on the H1 chart. So, there were a few moving averages which were keeping the buyers safe at 1.28 during this time, while at the top it was just the resistance level of the range.
That level has been broken now as Oil retraces lower. Oil prices are around $1 lower from the highs at above $70 yesterday. USD/CAD is 80 pips above the top of the range now and it is headed towards 1.30. That is another big round level, although it was broken to the upside in March, so it remains to be seen how strong a level will be this time around.
I suppose we could try a small short trade from there, targeting 25-30 pips as the price retreats on the first attempt. But, we have to follow the price action, again, to see if there will be a rejection there. If I see a pin or doji candlestick right below 1.30, then that would be a sign to open this trade. Oil is also finding support on the 50 SMA and might jump off it, so there is a case for a sell trade in USD/CAD.
- Check out our free forex signals
- Follow the top economic events on FX Leaders economic calendar
- Trade better, discover more Forex Trading Strategies
- Open a FREE Trading Account
- Read our latest reviews on: Avatrade, Exness, HFM and XM
Related Articles


Sidebar rates
Related Posts
