The 100 SMA Is Protecting Our USD/JPY Signal
We have an open USD/JPY signal. We decided to play the uptrend yesterday, but the pullback has stretched further below to the 100 SMA

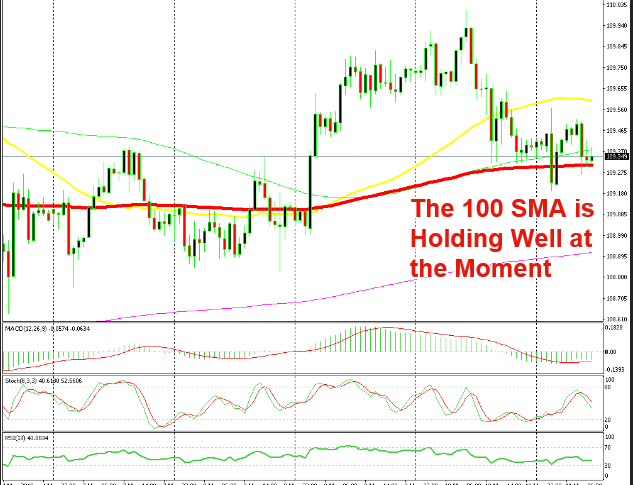
We have an open USD/JPY signal that you may have noticed, which we opened yesterday. We decided to buy this pair as it was retracing lower after trending up over the past few days. The price was finding support at the 50 SM (yellow) and it formed a couple of doji candlesticks.
The chart pattern was perfect for a bullish move. The stochastic indicator was oversold, the 50 SMA was providing support and the doji candlesticks pointed to a bullish reversal.
But, the US CPI inflation report missed expectations and another bearish move followed for the USD. That took USD/JPY below the 50 SMA, pushing as low as 109.30. At least, the 100 SMA (red) stood its ground well yesterday. The safe haven currencies have caught some nice bids in the last few days, so that’s not helping matters for us.
We saw another push to the downside in the early hours of this morning. The price pierced the 100 SMA but returned back up. Now, the 100 SMA is still holding the sellers with what it can, so it is trying to provide support.
The H4 chart is severely oversold which is a bit encouraging for buyers, but the H1 chart is still heading down with some more room to run. Well, we hope that the 100 SMA holds the line because there’s no more technical levels to protect our USD/JPY signal. So, all eyes on the 100 SMA.
- Check out our free forex signals
- Follow the top economic events on FX Leaders economic calendar
- Trade better, discover more Forex Trading Strategies
- Open a FREE Trading Account


