Gold Dips on Stronger Dollar – 38.2% Fibo Up Next
Yesterday during the New York session, gold plunged dramatically to hit its lowest this year as a surge in U.S. financing costs overshadowed
Yesterday during the New York session, gold plunged dramatically to hit its lowest this year as a surge in U.S. financing cost overshadowed the impact of the conflict in Gaza. Typically, the war sentiment drives safe-haven appeal in the market and makes yellow metal bullish but gold reversed in the wake of the stronger dollar.
The bearish momentum in gold picked up after the metal broke below the psychological level of $1,300. At the moment, gold is trading near $1,294, above an intra-day support level of $1,291.
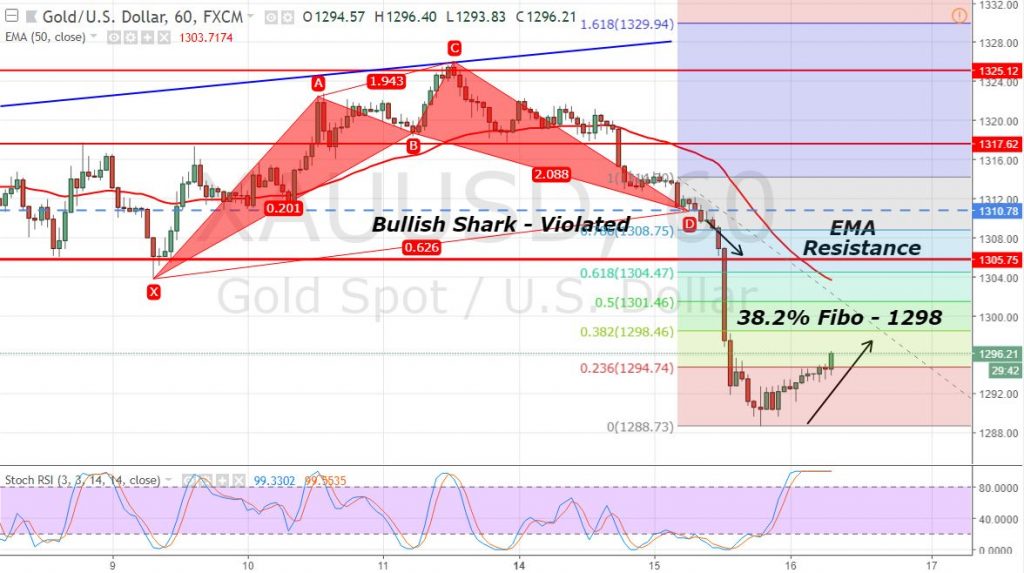
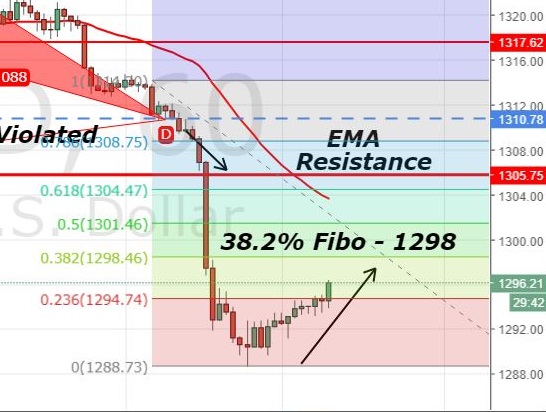
Gold – Hourly Chart
The candlestick pattern doji followed by a sharp bearish trend indicates that the sellers are exhausted and bulls are looming around the area. Additionally, the RSI and Stochastics have crossed above 50, signaling a buying trade. Gold has already completed 23.6% retracement at $1,294 and is now heading towards 38.2% Fib level of $1,298.
Gold – Key Trading Levels
Support Resistance
1288.28 1308.52
1282.02 1314.78
1271.9 1324.9
Key Trading Level: 1298.4
Fundamentally, the traders will be focusing on the U.S. industrial production and building permits to determine further price action. Considering this factor, we open a forex trading signal to buy gold above $1,294 and target $1,298 with a stop below $1,291.
- Check out our free forex signals
- Follow the top economic events on FX Leaders economic calendar
- Trade better, discover more Forex Trading Strategies
- Open a FREE Trading Account