Forex Signals US Session Brief, May 17 – Trading the Market Sentiment and the Charts
Today the important economic data has been released. We won't get much action from the data, so we will follow the charts and the sentimet

Today’s major forex data release took place in the early morning hours with the Australian unemployment rate ticking up 0.1% higher, which my Australian colleague Rowan covered. For the rest of the day, the data is pretty light. This leaves the charts and the market sentiment to do all the work and ensure that the market doesn’t get stuck.
The Forex Market Today
As we mentioned, new jobs beat expectations in Australia, but the unemployment rate ticked up higher from 5.5% to 5.6%. Commodity currencies have enjoyed some bids today in the morning, but the increase in the unemployment rate has kept the Aussie in check. That’s good for us since we have a sell forex signal in this pair. If you are wondering, the unemployment rate is defined by the number of people registering for unemployment benefits, so the increase in new jobs looks contradictory but does not count.
We had some fun with Brexit once again. Last night, The Telegraph published a piece implying that the UK government has accepted to stay in the Customs Union within the EU. The GBP made a strong rally overnight but returned back down this morning. The UK Prime Minister Theresa May dismissed such claims earlier today, hence the bearish reversal a few hours ago. Although, to me it seems that the UK is taking that path exactly and Theresa May is just playing it cool. If the UK remains in the Customs Union, then this would be positive for the GBP and I expect to see 1.40 soon, let’s wait and see though.
In a short while, the US ADP employment report and the Philly FED manufacturing index are to be released. These are not major market movers, but if the numbers are really surprising, be it for better or for worse, then there should be some nice price action for us to trade.
The manufacturing is expected to decline from 23.2 points to 21.1 points. The unemployment claims are expected to increase by 5k, so the surprise is likely to be positive if anything. That would be another positive factor for the USD, which is still charging forward.
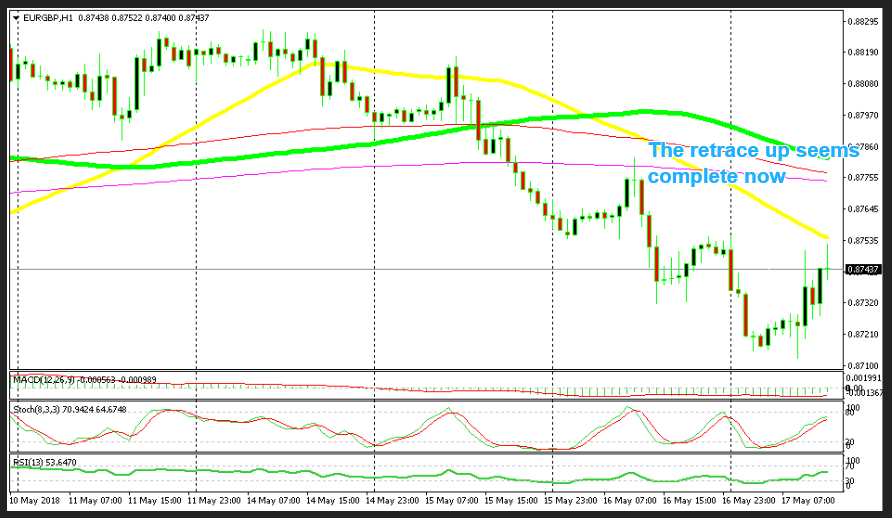
A Quick Trade in EUR/GBP
On Monday, I analyzed the Bitcoin chart and it looked bullish to me. The price had formed a doji on Saturday which is a reversing signal after retracing down for about a week. That reversing signal was followed by a big bullish candlestick on Sunday, so the chart formation looked quite bullish.
The trend has been bullish for about a month and the retrace lower was complete. So, the next logical move was up and it had already begun, as we explained above.
But, the daily candlestick on Monday closed as a doji which is a reversing signal again. This time it was a bearish reversing signal since the price had climbed up in the previous couple of days. Bitcoin and other cryptocurencies reversed back down yesterday and that sort of price action continued today as well.
Bitcoin fell to $8,070 according to my platform, piercing the 50 SMA (yellow) which had provided support since Sunday. That didn’t look good for buyers like us. Remember that we have a long term buy forex signal which we opened on Monday.
Although, the sellers called it a day down there, buyers returned again. Now the price has climbed back above the 50 SMA which is a good sign for us. If the buyers manage to push Bitcoin another $100 higher, then the daily candlestick would close as a pin. That would be a really bullish sign, so let’s hope that Bitcoin climbs higher and it might as there’s still plenty of day left until midnight when the daily candlestick closes.
Trades in Sight
Bullish USD/CAD
- The bearish move looks complete
- Stochastic is oversold
- The 50 support is holding
- The previous candlestick closed as a doji
- Oil prices are on the rise, while the CAD is slipping lower
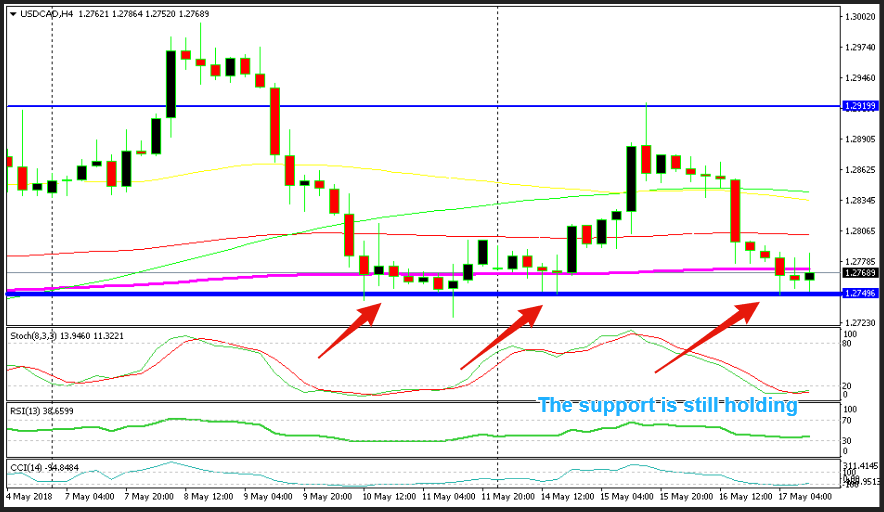
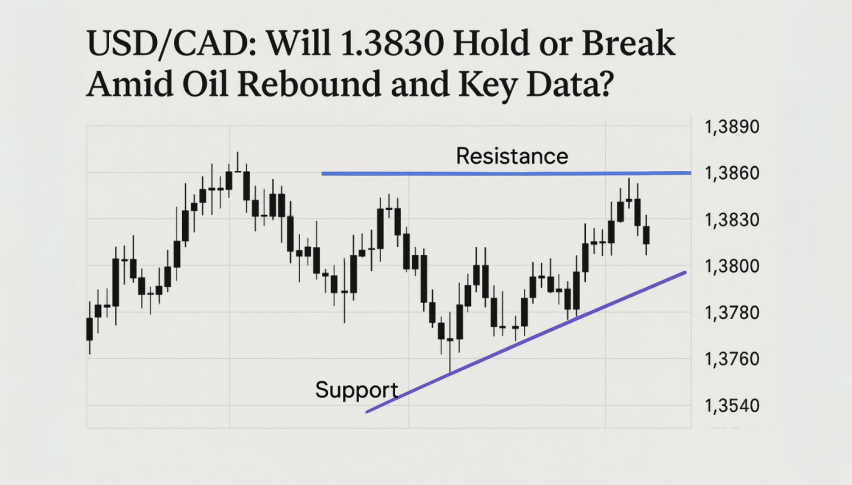
OK, this last point is the most important actually. Oil prices and the CAD are closely correlated. The CAD has benefited from increasing Oil prices, which are still surging today. But it seems like the correlation is lost today, as Oil is still climbing while the CAD is declining, which means USD/CAD is moving higher. Perhaps, the chart formation has scared USD/CAD sellers away. According to this sort of price action, if Oil starts to retrace lower, the CAD will lose even more ground so USD/CAD will likely continue to move higher. The target is the top of the range at 1.29 first, then 1.30.
- Check out our free forex signals
- Follow the top economic events on FX Leaders economic calendar
- Trade better, discover more Forex Trading Strategies
- Open a FREE Trading Account