Choppy Trading In Gold – Brace yourself for a Breakout
The gold is having a choppy session, trading in a narrow range of $1,287 - $1,294. It's mostly because the fundamental side is on a lighter.
Gold is having a choppy session, trading on a narrow range of $1,287 – $1,294. It’s mostly because the fundamental side is on a lighter side today. The U.S. yields remain near and keeping the dollar high in power. However, the ongoing tensions between Israel and Palestinians keep the markets uncertain. As you know, where there is uncertainty, investors prefer to invest in haven assets. That’s one of the reasons underpinning the yellow metal.
Gold – XAU/USD – Technical Outlook
Well honestly, the technical side of the market hasn’t changed much. Both of the leading indicators, the RSI and Stochastics are indicating overbought conditions. But I think it’s useless to see the leading indicators while the market is range bound.

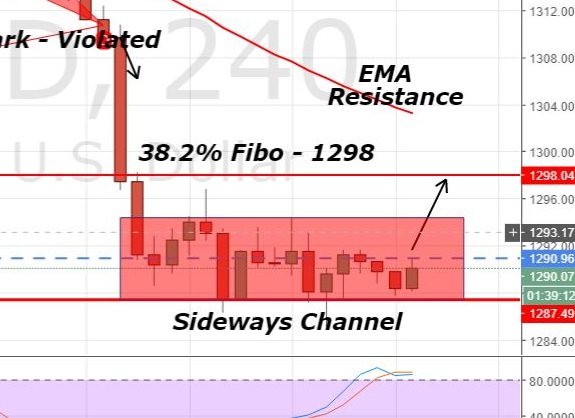
Gold – 240 Mins Chart
On the hourly chart, Gold is stuck in the sideway channel which is supporting gold near $1,287 along with a resistance near $1,294. Soon we are going to see a breakout in the sideways pattern.
Support Resistance
1285.31 1292.49
1283.09 1294.71
1279.5 1298.3
Key Trading Level: 1288.9
Gold – XAU/USD – Trade Idea
Typically, gold mostly gets volatile during the U.S. session. We should expect a breakout in gold. So, the idea is to stay bearish only below $1,287 to target $1,281. On the flip side, gold is likely to stay bullish above $1,288. Good luck.
- Check out our free forex signals
- Follow the top economic events on FX Leaders economic calendar
- Trade better, discover more Forex Trading Strategies
- Open a FREE Trading Account


