The 100 SMA Resists in USD/CAD, What Now? Technical and Fundamental Analysis
USD/CAD has been trading in a bearish trend last month, but in May this pair has been trading in a range. Time to have a good look at it now

USD/CAD has been trading in a bearish trend last month, but in May this pair has been trading in a range. This sort of price action has been a result of both, technicals and fundamentals. I highlighted a few of the factors that have been affecting this forex pair during last week, so now it’s time to have a better look before we start the new week.
The Fundamental Elements
The NAFTA Agreement
The countries of North America Mexico, the US and Canada have been negotiating about the NAFTA deal and there have been rummours and comments that they were getting close to a consensus. But, the US Trade Representative Lighthiser denied such a thing. He actually added that the three North American countries are nowhere near an agreement and the time is running out.
USD/CAD reversed on those comments in Friday evening but there is another factor which contributed to that reversal as well. We’ll explain it below.
Donald Trump had a phone call with the Canadian Prime Minister Justin Trudeau. That cal might have helped to reach a consensus, but knowing Trump, it’s quite possible that it could have been the opposite. Trump is reputable for being impatient, so I think he is probably giving up on that idea, not that he liked it in the first place. He abolished the previous agreement, didn’t he.
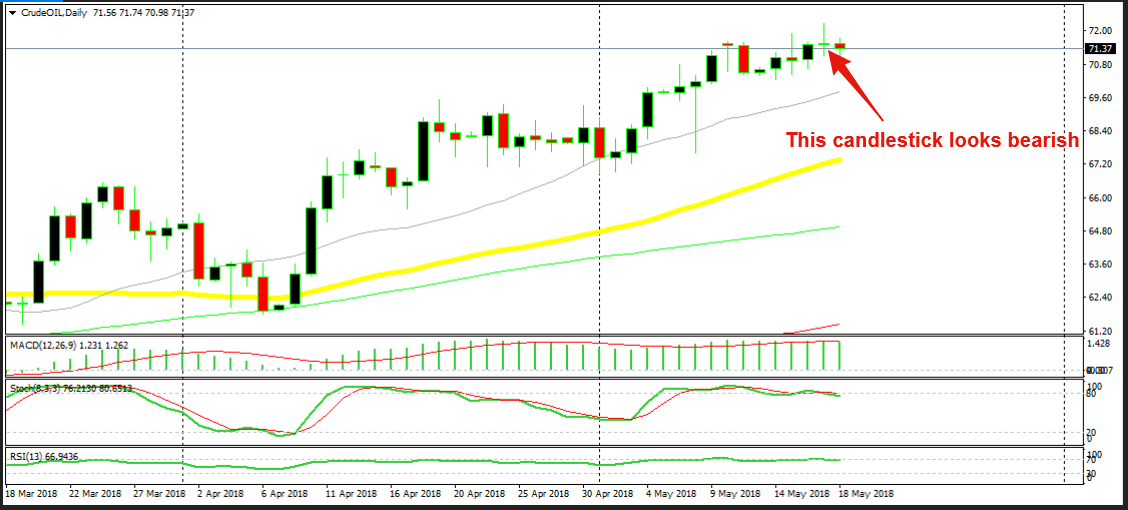
Oil has been another factor in the reversal that we saw on Thursday afternoon. As you can see from the daily chart below, US Oil has been on a strong uptrend. Trump scrapped the Iran deal and the latest conflict on the Israel border has increased fears for a disruption in Oil output, hence the uptrend. Although, Oil prices started pulling back lower on Thursday, exactly when USD/CAD started reversing higher.
The Technical Elements
USD/CAD has been trading on a range this month. the top of the range is not defined properly. It could either be 1.2920 which has been the high last week or 1.30 which is a big round number as well as providing resistance earlier this month.
The bottom is very clear though. It has been defined by the 100 SMA (red) on the daily chart. While the price might have pierced it a few times, it is this moving average where USD/CAD reversed twice in the last two weeks. Now, the stochastic indicator is reversing back up and it looks like bulls are in charge now. But, the resistance at 1.2920 held again on Friday.
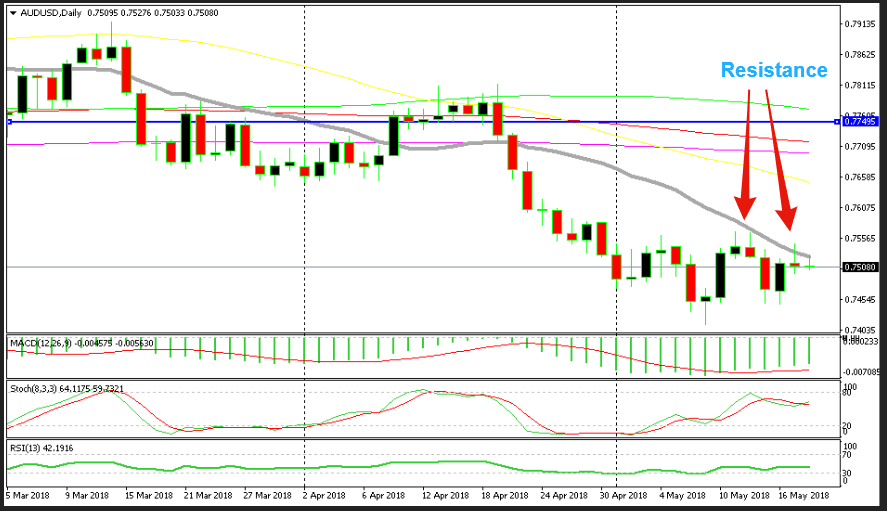
So, it is this level which is the first target for USD/CAD buyers. If that level goes, then 1.30 is next. It was resistance early this month. After that, it’s the level at 1.3120 as the ultimate resistance. Well, these are the targets and if NAFTA negotiation are abandoned, then they could go pretty easily.
- Check out our free forex signals
- Follow the top economic events on FX Leaders economic calendar
- Trade better, discover more Forex Trading Strategies
- Open a FREE Trading Account


