Shorting GBP/USD Again On A Bearish Chart Setup
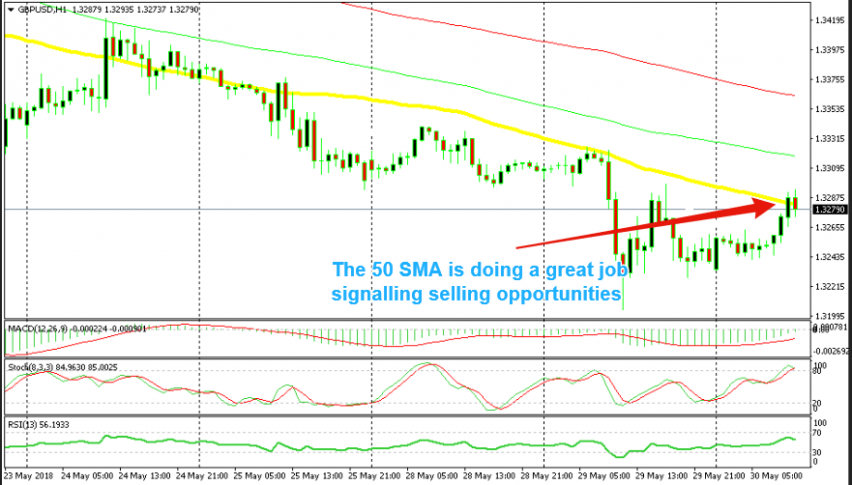
Yesterday we sold GBP/USD as it was approaching the 50 SMA (yellow). It wasn’t in the early hours though, when the price reached that moving average. We sold this pair in the afternoon as it was retracing higher from 1.32. The price didn’t reach the 50 SMA, but we decided to sell because the price action seemed as if a reverse down was about to commence.
We sold GBP/USD again a while ago and it was for the same reason, this pair was retracing up and the price action pointed to another reverse down. This time though, the technical indicators are much clearer in pointing out a bearish reversal.
Technical Indicators
The main indicator for this signal was the 50 SMA obviously. Unlike yesterday when we sold GBP/US, this time the price reached this moving average. It pierced above it briefly, but it started to reverse back down. So, we decided to sell before the reverse was in full force.
Besides that, the stochastic indicator was well oversold when we opened this forex signal today. Yesterday, stochastic wasn’t oversold when we sold this pair. The bearish reverse came nonetheless.
The trend is extremely bearish, so we are on the right side of the market, for the time being. According to the technical chart setup, the odds are better for sellers today. So, we decided to take another trade on this pair which is going well at the moment. The USD has been retracing against most majors this morning, so let’s get this update posted and see if we can have one or two other forex trades in other pairs.


