EUR/USD Faces A Major Resistance Indicator
The market sentiment has improved since yesterday and risk currencies are receiving some nice bids. EUR/USD has made quite a comeback...

The market sentiment has improved since yesterday and risk currencies are receiving some nice bids. EUR/USD has made quite the comeback and has climbed more than 200 pips from the lows in the last two days.
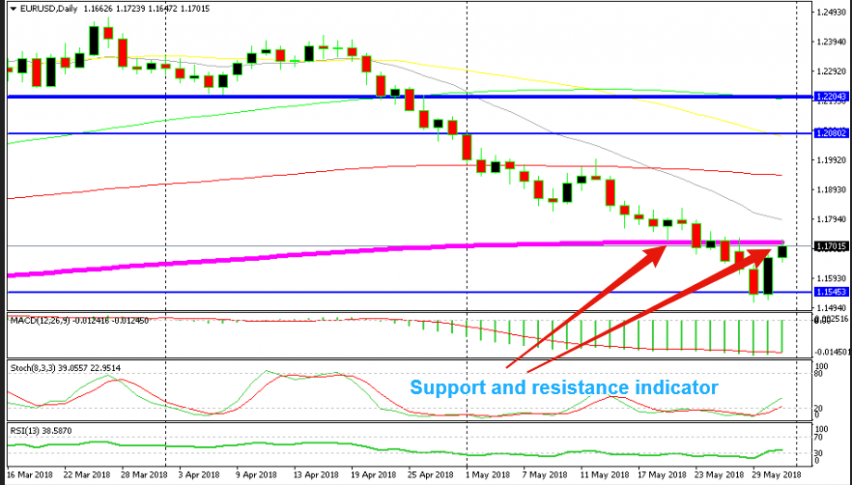
But now it faces a major technical indicator on the daily chart. That indicator is the 200 SMA (purple). The daily EUR/USD chart above doesn’t show the whole picture. But if you scroll back on your own chart you can see that the 200 smooth MA has provided resistance during 2016 many times. It also provided resistance a couple of times in 2017 as well.
From the above chart, we can see that the 200 SMA tried to provide support last week when EUR/USD was on its way down. But, the bearish move was too strong to be stopped by a technical indicator. Technical indicators are good to signal trades. But, we should trade them when they point to the same side of the trend, like now for example.
The trend is down and the 200 SMA is providing resistance. So, they both are pointing down. Right now, EUR/USD is trading at 1.1680, 20 pips above the opening price. If the daily candlestick closes at the opening level, then it will be another sign to go short on this pair. The daily candlestick would look like a doji which is a reversing signal. The stochastic indicator on the daily chart is not overbought, so, the retrace up is not complete on this time-frame, but the downtrend is too strong so don’t expect a full pullback.
- Check out our free forex signals
- Follow the top economic events on FX Leaders economic calendar
- Trade better, discover more Forex Trading Strategies
- Open a FREE Trading Account


