Bullish Setup for EUR/USD on the Weekly Chart
EUR/USD has been on a strong bearish trend in the last two months. It has lost about 10 cents from top to bottom during this period, but now

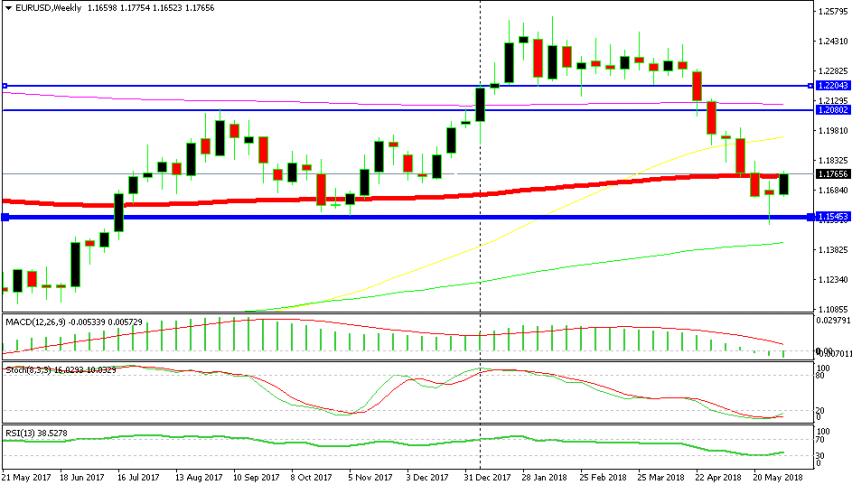
EUR/USD has been on a strong bearish trend in the last two months. It has lost about 10 cents from top to bottom during this period, but now the weekly charts have formed a bullish reversing pattern. Is this forex pair going to resume the bullish trend that it started in January last year?
We can’t know that, but a decent retrace up is definitely on the cards from what the weekly chart tells us. As you can see, the decline stopped right at the major support area. That support range stretches from 1.1500 to 1.1550. The price reached 1.1510 last week where the decline came to an end. So, that support and resistance area still remain.
That is on bullish reversal sign. The next one comes from the weekly candlestick. Last week’s candlestick closed as a hammer. The hammer after a downtrend signals a reverse to the top side.
The stochastic indicator is severely oversold, which means that the fall has reached its limits for now. Even if the downtrend continues, a pullback higher is needed to refresh the trend. So, a decent pullback is on the cards.
This week’s candlestick in EUR/USD already looks bullish and it is worth more than 100 pips. So, the pullback is already underway. I am looking at 1.20, 1.21 and 1.22 as targets for this move. When we get up there if we do, then I will see if I can open a long term sell forex signal in this pair.
- Check out our free forex signals
- Follow the top economic events on FX Leaders economic calendar
- Trade better, discover more Forex Trading Strategies
- Open a FREE Trading Account


