S&P 500 Trades Risk-off Sentiment – Descending Triangle Pattern Eyed
The global stock indices are trading in the bearish in the wake of growing trade tensions between the United States and China. The recent...
What’s up, fellas.
The global stock indices are trading bearish in the wake of growing trade tensions between the United States and China. The recent tweet from the POTUS has fueled the demand for haven assets.
As we discussed before, Trump shook the stock markets by threatening to impose a 10% tariff on $200 billion worth of Chinese goods and a 20% tariff on all European assembled cars entering the U.S. markets.
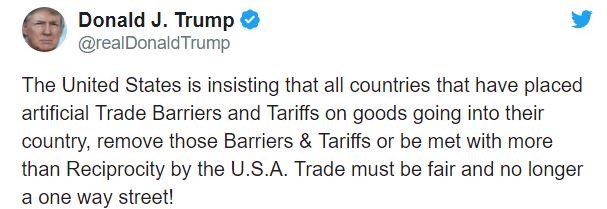
During the weekend, Trump asserted via Twitter that “all countries that have placed artificial trade barriers and tariffs on goods going into their country remove those barriers and tariffs or be met with more than reciprocity.”
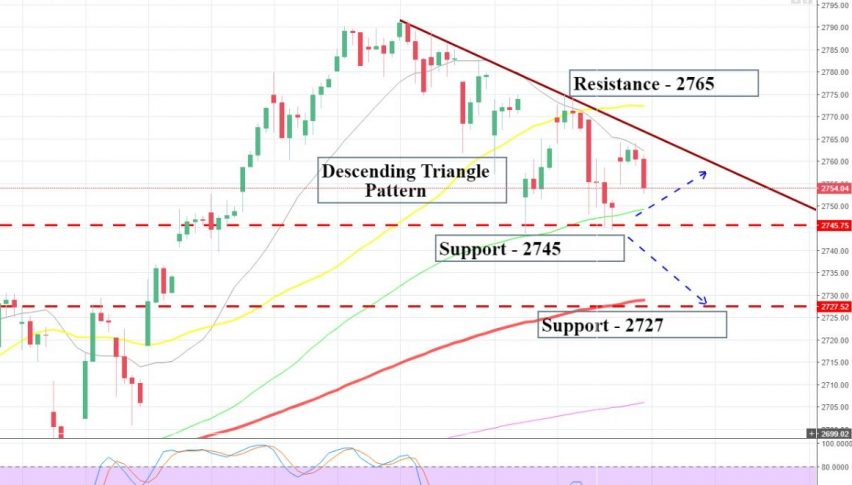
S&P 500 has formed a descending triangle pattern on the 2-hour chart which is supporting the index near $2,745. Typically, the descending triangle patterns break on the lower side. Let’s see what happens today.
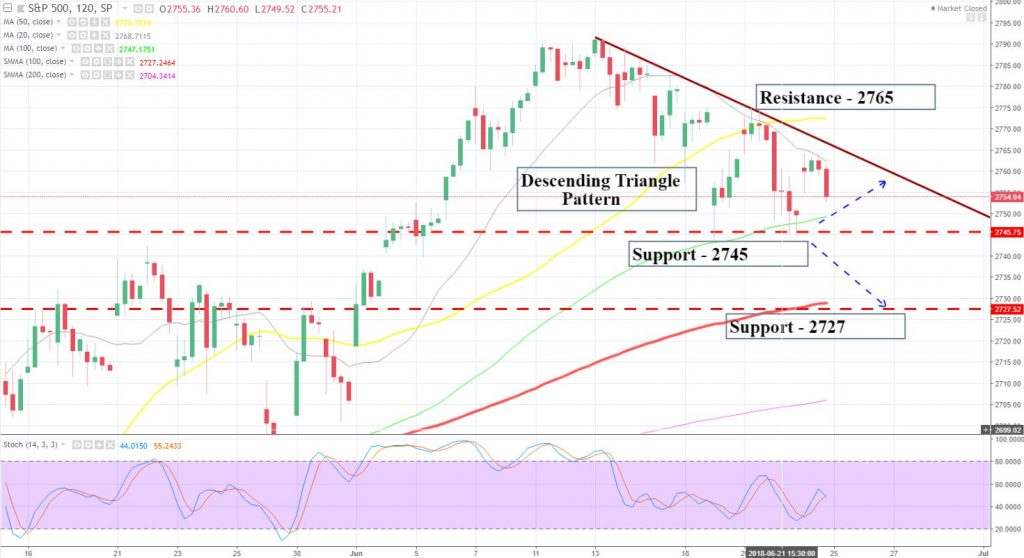
SPX -2 Hour Chart – Triangle Pattern
The violation of triangle pattern on the lower side is likely to add further selling until $2,727. Whereas, the 50 periods EMA is likely to provide resistance near $2,765.
SPX - S&P500- Key Trading Levels

Support     Resistance

2744.97    2763.99

2739.1    2769.86

2729.59    2779.37

Key Trading Level:    2754.48
Investors are advised to monitor $2,745 as the markets are likely to stay bullish above this until $2,765. Whereas, the selling entries are preferred below $2,740 to target $2,727. Good luck!
- Check out our free forex signals
- Follow the top economic events on FX Leaders economic calendar
- Trade better, discover more Forex Trading Strategies
- Open a FREE Trading Account