Bitcoin (BTC/USD) Violates Triple Bottom – A Swing Trade Idea
Bitcoin is trading near $6,200 after crashing below $6,000 to reach its lowest value in almost eight months. Looks like the traders...

Bitcoin is trading near $6,200 after crashing below $6,000 to reach its lowest value in almost eight months. Looks like the traders continue to react to recent accusations of price manipulation and the bitcoin hack news.
The crash in bitcoin was initiated after Bithumb exchange reported that hackers had stolen $31 million worth of cryptocurrency from its online vaults. Since it has happened for the second time in a row, crypto investors seem hesitant to invest in the market.
BTC/USD – Triple Bottom Breakout
We can see on the daily chart that bitcoin has violated the triple bottom pattern which supported BTC near $6,565. Zooming out on the chart, you will also find a descending triangle pattern which has been violated on the lower side.
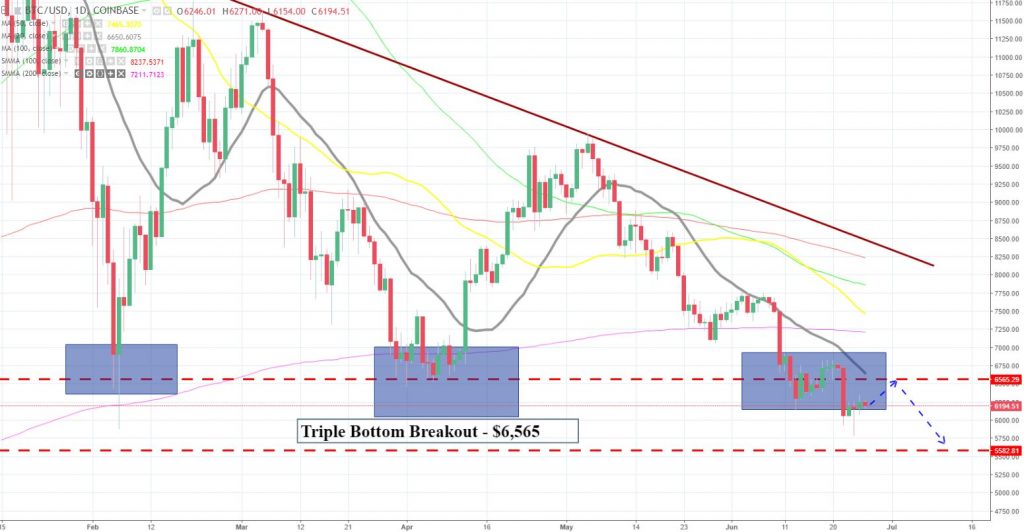
BTC/USD – Daily Chart
The market has formed a bearish engulfing candle which along with the 50, 100 and 200 periods moving averages suggesting a strong bearish sentiment of investors. BTC/USD can face a strong resistance at a level of $6,565 and below this, the market can go after $5,580.
Key Technical Levels – BTC/USD
Support Resistance
5796.2 6698
5415.3 7218.9
4894.4 7599.8
Key Trading Level: 6317.1
BTC/USD – Trade Idea
Crypto junkies are suggested to stay bearish below $6,300 to target $5,700 along with a stop loss above $6,600. Good luck.
- Check out our free forex signals
- Follow the top economic events on FX Leaders economic calendar
- Trade better, discover more Forex Trading Strategies
- Open a FREE Trading Account