Gold Breakout of Descending Triangle – Safe-Haven Dominates
Investors seem to move their investments in the gold. Actually, that's one of the reasons why gold prices have soared to a one-week high...
Recalling FX Leaders July 4- Economic Event’s Brief, the July 6 tariff war has generated an immense amount of uncertainty in the market. Consequently, the market sentiment has switch from risk-on to risk-off. Investors seem to move their investments into gold. Actually, that’s one of the reasons why gold prices have soared to a one-week high today, rebounding from a six month low.
In addition to this, a weaker dollar is also extending support to the bullion due to its negative correlation factor.
Fundamentally, gold got all the bullish support since the U.S. is due to begin inflicting tariffs on Friday (July 6) on $34bn worth of imports from China. The demand for safe-haven assets is at its peak nowadays. Most probably, gold will continue trading the same sentiment until the release of U.S. non-farm payroll and implementation of tariffs on China. Next week is gonna be very exciting from a trading point of view.

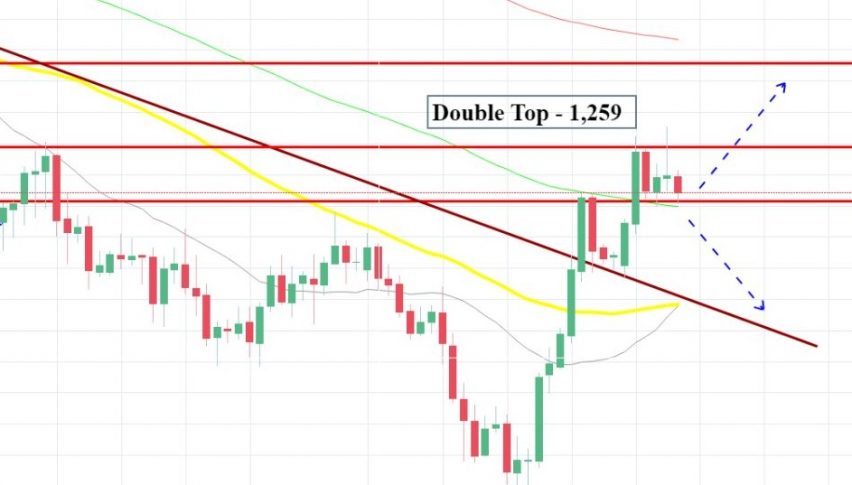
Gold – 2 Hour Chart
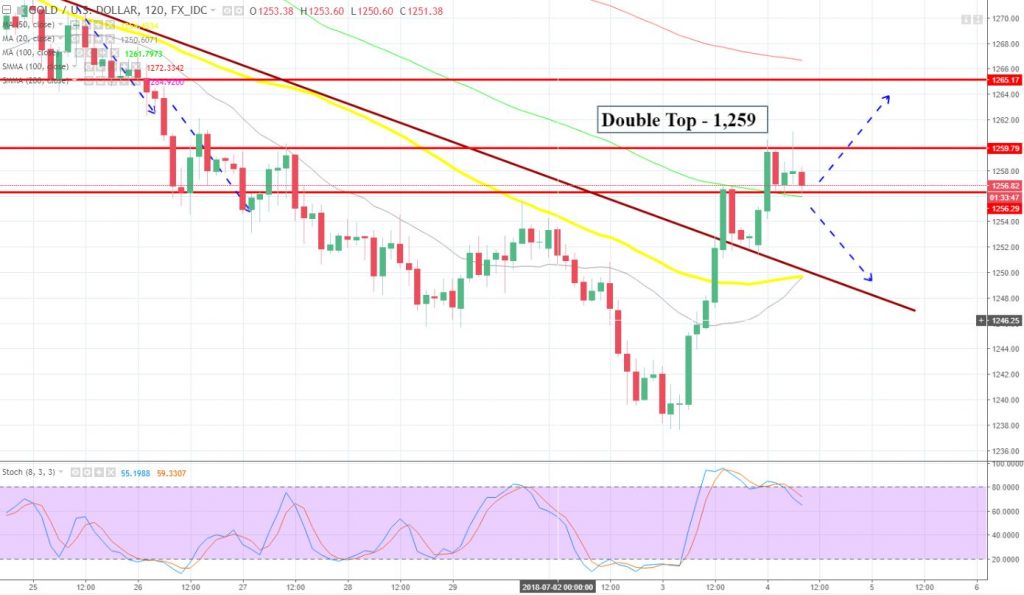
Presently, gold is facing a resistance near $1,262 along with a support near $1,257. The 50 – periods EMA is supporting the bearish trend. The violation of $1,257 can extend the bearish rally towards $1,251. Whereas above $1,261, the market can stay bullish until $1,265.
Gold – XAU/USD – Trade Idea
Today, the idea is to stay bullish above $1,252 with a stop near $1,248 and take profit at $1,262. Good luck!
- Check out our free forex signals
- Follow the top economic events on FX Leaders economic calendar
- Trade better, discover more Forex Trading Strategies
- Open a FREE Trading Account
- Read our latest reviews on: Avatrade, Exness, HFM and XM
Related Articles

Sidebar rates
Related Posts
