A Double Bottom Makes Perfect Sense in EUR/USD with Target at 1.22
EUR/USD has been declining pretty hard from the beginning of April until the end of May. But now it has formed a double bottom pattern.
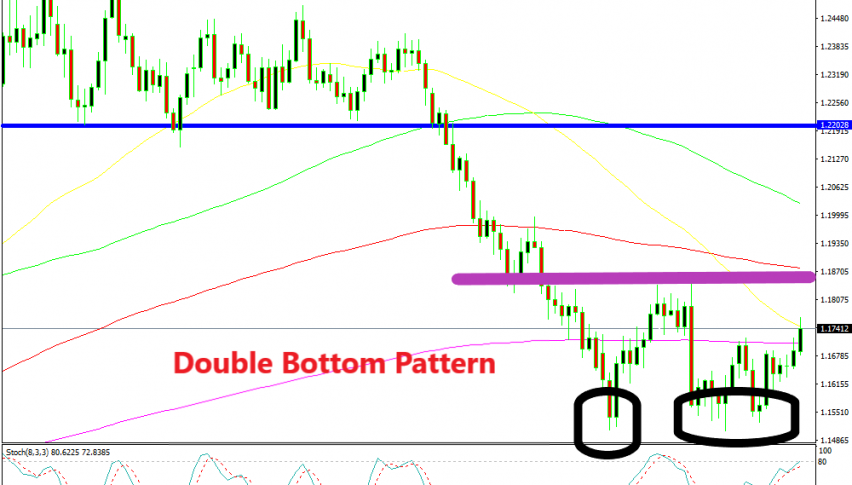
EUR/USD has been declining pretty hard from the beginning of April until the end of May. The range which lasted for about 4 months since the start of the year, was finally broken and this pair entered a downtrend for the next several months. The range stretched from 1.22 at the bottom to 1.2500-1.2550 at the top. We will mention the bottom of the range later on in this long term technical analysis.
So, EUR/USD lost more than 10 cents during spring months but found strong support at 1.15. That is a major psychological level and it has acted as support and resistance years ago, which means that it is quite important. If it breaks, it opens the door for 1.10 and probably lower. In May, sellers have tried the downside a few times but this level has held its ground very well.
So, we have two bottoms in place only a handful of pips above 1.15. The double bottom pattern means that we will see a bullish move soon. If you look at the monthly EUR/USD chart, you will see that the 50 SMA (yellow) has moved below the price and now it stands just above 1.15. This is a second indicator which points to a bullish move.
The third technical indicator is the stochastic indicator. It has now reached the oversold area which makes this pair oversold on the monthly chart. That’s more important than the daily chart. by the way, the weekly chart is severely oversold.
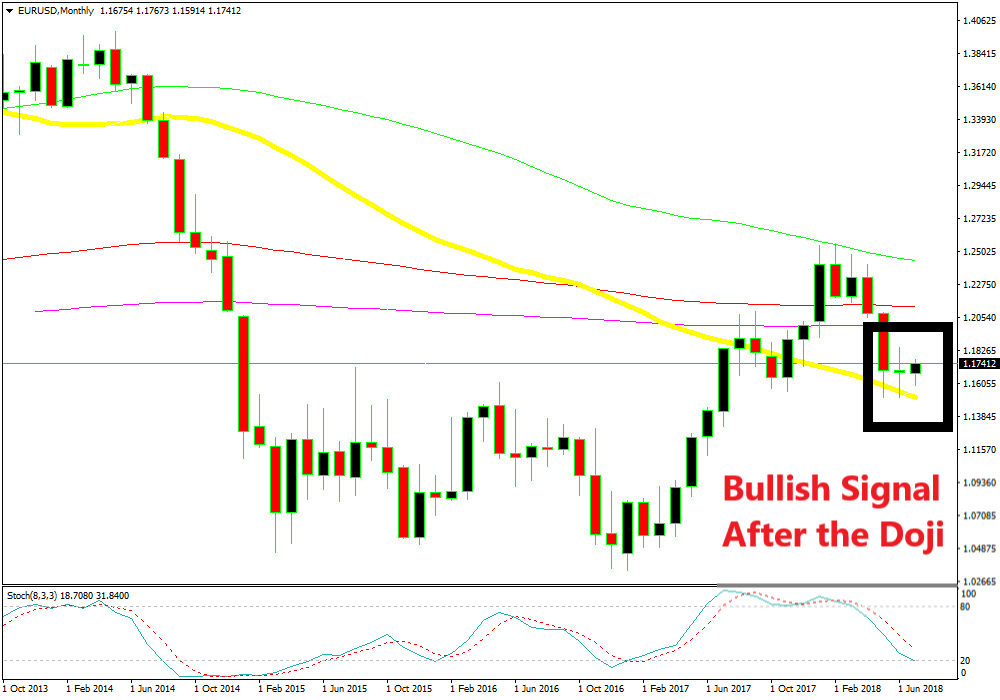
This month’s candlestick is already starting to look bullish
The fourth indicator to point up is the previous monthly candlestick. The price moved up and down roughly between 1.15 and 1.1850 in May and the candlestick closed as a doji. The doji is a reversing signal after the bearish move. That makes it four signals pointing up, although what’s more interesting is the double bottom.
As May’s candlestick suggests, the range is 350 pips wide. If the double bottom pattern works as it is supposed to, also helped by the other indicators, then we should see EUR/USD move 350 pips above the top level of the range. Funny enough, the attention now comes back to the 1.22 level. This level stands 350 pips above 1.1850. It has been a strong support level and will likely turn into solid resistance now.
So, the 1.22 level will be the target if the double bottom pattern is to work out. But first, the buyers must push above 1.1850 for this pattern to come into play. If that happens, then we might be persuaded to take a long trade in this pair. Although, the safest trade would be to sell at 1.22, but one step at a time.
- Check out our free forex signals
- Follow the top economic events on FX Leaders economic calendar
- Trade better, discover more Forex Trading Strategies
- Open a FREE Trading Account
- Read our latest reviews on: Avatrade, Exness, HFM and XM
Related Articles


Sidebar rates
Related Posts
