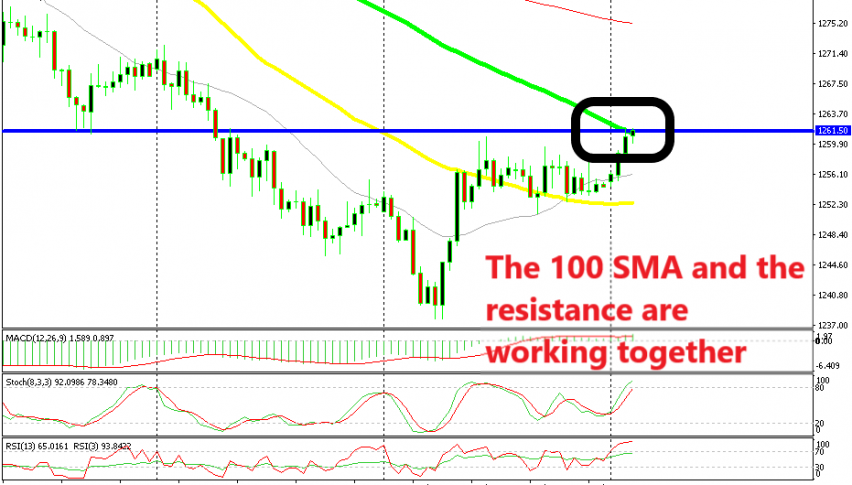
Gold facing the 100 SMA After It Overcame the 50 SMA
The decline in Gold stopped right at the 50 SMA on the monthly chart and stochastic became oversold. So, the technicals are driving Gold now

Despite the negative sentiment in financial markets during the last few months, Gold has been declining pretty fast. When the market sentiment is negative, safe-haven assets such as Gold should rally. Safe haven currencies did rally with the CHF gaining considerable pace during the last 3-4 months.
Yet, Gold kept falling lower. Although, the situation changed last week. The decline stopped right at the 50 SMA on the monthly Gold chart and stochastic became oversold. So, the technicals are driving the price of Gold around now and it seems as a retrace higher is underway.
Looking at the monthly chart, Gold was finding some mild resistance at the 50 SMA (yellow) early last week, but it didn’t last long. That moving average got broken and after that it turned into support.
Today, Gold has moved away from the 50 SMA on the H4 chart and has climbed around $6 so far. But now, it is trading just below the 100 SMA on the same chart. This moving average is providing resistance and the stochastic indicator is overbought.
The daily chart is also overbought
This means that the retrace up is complete and the downtrend should resume soon. Although, we must have a second opinion, so we switch to the daily chart. In this timeframe, we can find the 20 SMA (grey) right where the 100 SMA stood on the H4 chart. Stochastic has just reached overbought levels here as well, so the retrace seems complete here too.
Besides that, we see that the area around $1,261 used to be support. Now, it is supposed to turn into resistance, considering that the moving averages will provide additional strength to that level. Will Gold reverse down now? No one knows, but the technical analysis tells us so.
- Check out our free forex signals
- Follow the top economic events on FX Leaders economic calendar
- Trade better, discover more Forex Trading Strategies
- Open a FREE Trading Account
.png)


