The 50 SMA Turns Into Solid Resistance for EUR/USD
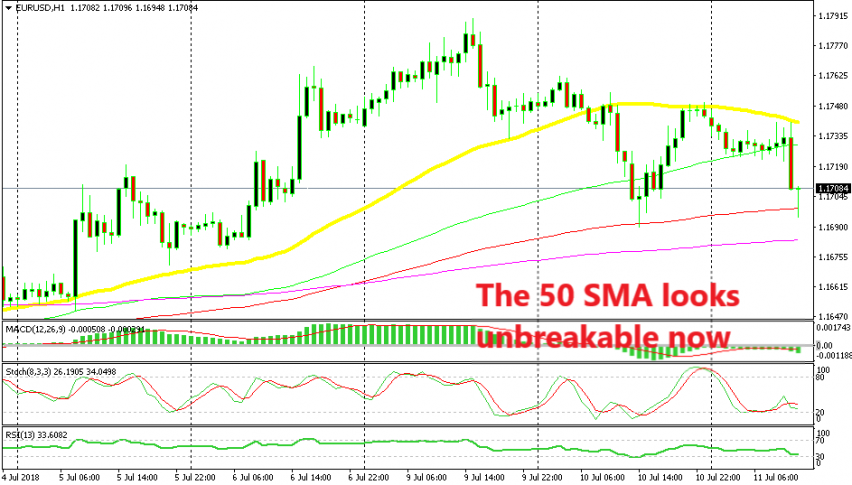
Yesterday I highlighted the 50 SMA (yellow) in EUR/USD. This pair broke that moving average on the H1 chart but reversed in the afternoon and headed back up towards the 50 SMA. If you follow our forex updates, then you would have noticed the trade idea that I posted there. Basically, I said in that update that if EUR/USD climbed to the 50 SMA, then that would be a great opportunity to go short on this pair.
Well, the price reached the 50 SMA twice; once last evening and again this morning. Both times, the 50 SMA provided solid resistance for this pair. The idea was that after the bearish chart formation on the daily timeframe, a retrace up to the 50 SMA on the H1 timeframe would be a good opportunity to sell.
We missed both opportunities, but I hope you took one of those trades. This moving average provided some mild support on the way up for EUR/USD and now it has turned into a strong resistance indicator.
The daily chart still looks pretty bearish to me since the stochastic indicator is overbought and heading down. But, the 100 SMA (red) on the H1 chart is holding on at the moment. That moving average stands close to 1.17 which is a big round level in itself.
This latest bearish move came after Draghi’s speech. The president of the European Central Bank didn’t touch the monetary policy this morning, but the Euro started sliding lower. There is some USD strength at the moment, but it is fading.
Stochastic is almost oversold on the H1 chart, so if you are trading EUR/USD you might as well think about a pullback higher. So, going long here for a couple of dozens of pips makes sense. Then, the 50 SMA would be a great place to go short again, rinse and repeat.


