Bitcoin Fails to Break the 50 SMA for the Second Day
Bitcoin made an impressive rally yesterday. It climbed around $800 and closed the day near the highs. That was a sign that Bitcoin might...
Bitcoin made an impressive rally yesterday. It climbed around $800 and closed the day near the highs. It was a sign that Bitcoin might break above the 50 SMA on the weekly chart. This moving average has provided strong support for Bitcoin on the way down when cryptocurrencies were crashing after the gold rush in December last year.
Bitcoin made a bullish reversal last month and over the last two weeks, the bullish move picked up pace. As a result, Bitcoin broke all moving averages that had been providing resistance on the daily chart. This was a sign that the buyers finally took control of the situation and now Bitcoin is supposed to enter a major bullish run.
Besides the technical indicators which were severely oversold and pointing up, the fundamentals also pointed up for Bitcoin. Major hedge funds and other financial institutions such as investment banks are considering investing in Bitcoin and other cryptos.
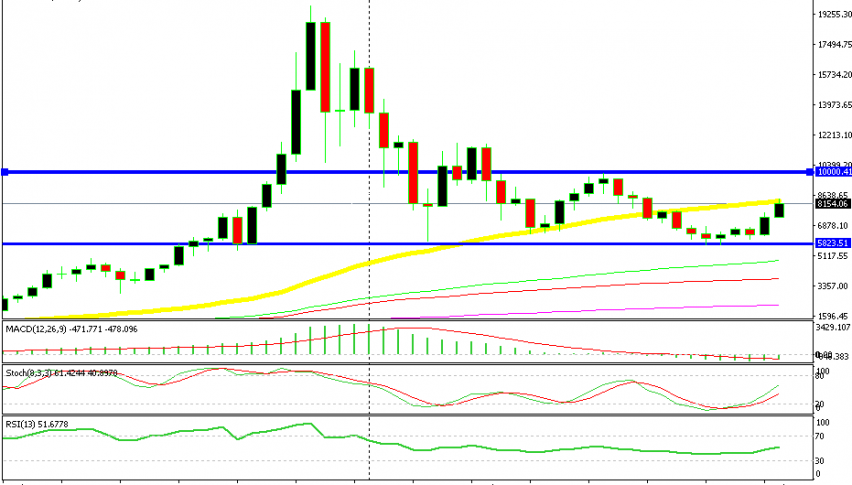
But, Bitcoin started having trouble overcoming the 50 SMA (yellow). As I mentioned, this moving average has provided support twice earlier this year and if it is not broken soon, the risk for this latest uptrend is that the buyers might see this as a sign that the major bearish trend is still in play and they will close their buy positions.
If that happens, other Bitcoin traders will reverse to short on Bitcoin and that would surely send this crypto down. After all, forex is a self-fulfilling prophecy. If everyone thinks that the price will fall, then traders will start selling and the price will fall as a result. That’s why I am not going long on Bitcoin right now.
I still have a bullish bias for Bitcoin, but I will probably wait until a decent retrace lower is complete and then go long. The levels I am watching are $7,500 and $7,000. Both are decent levels on the daily chart and moving averages stand on those levels. But, let’s see first if Bitcoin really starts turning bearish after the failure to break the 50 SMA or whether it actually breaks above the 50 SMA.
- Check out our free forex signals
- Follow the top economic events on FX Leaders economic calendar
- Trade better, discover more Forex Trading Strategies
- Open a FREE Trading Account