The 20 SMA Defines the Uptrend in Crude Oil on the Weekly Chart
Crude Oil turned bullish about two years ago, but in the last year, the uptrend took form. In the second half of last year, the uptrend was
Crude Oil turned bullish about two years ago, but in the last year, the uptrend took form. In the second half of last year, the uptrend was pretty solid and the retraces lower were quite minimal. This year, the uptrend has stretched further but it hasn’t been so straightforward.
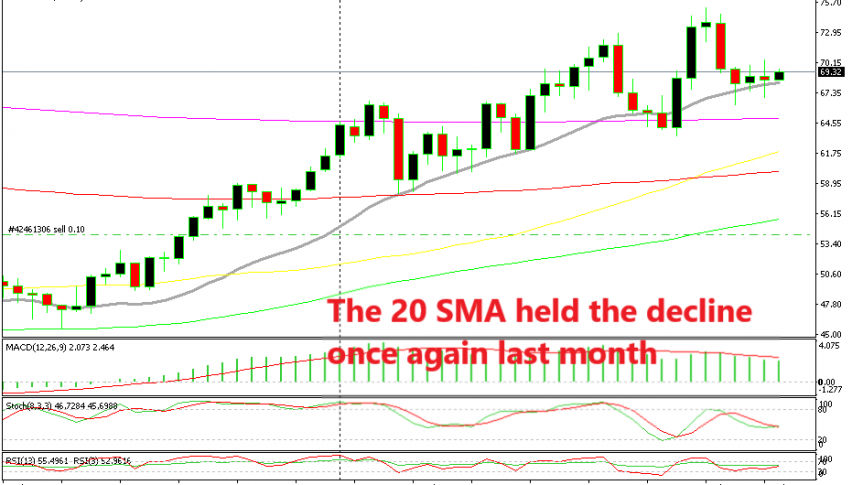
As you can see from the Weekly chart above, there have been several decent pullbacks lower. The stochastic indicator hasn’t reached oversold levels on every pullback this year, but they have been pretty decent, worth $5 at least.
Last month, Crude Oil made the last retrace lower after it failed to hold on above the $75 level. It formed a doji on the weekly chart and it entered the retracing mode in the next two weeks. But, the retrace lower ended right at the 20 SMA (green). This moving average has been providing support during the uptrend this year, so that is the defining indicator for the uptrend.
Stochastic didn’t reach the oversold area again, but it is starting to reverse higher now, which makes you think that the pullback might be over and the uptrend is about to resume soon. In the previous two weeks, the price formed two doji candlesticks which are reversing signals after the retraces.
This week’s candlestick has started as a bullish one and Oil has already climbed around $1 higher. So, according to this chart setup, Crude Oil is about to resume the uptrend. Are you planning to go long here? If so, I would suggest that you place the stop loss below the 200 SMA (purple).
- Check out our free forex signals
- Follow the top economic events on FX Leaders economic calendar
- Trade better, discover more Forex Trading Strategies
- Open a FREE Trading Account
- Read our latest reviews on: Avatrade, Exness, HFM and XM
Related Articles

Sidebar rates
Related Posts
