The US Inflation On The Cards – How To Trade Gold Today?
So far, it’s been a good start to the day as team FZ Leaders closed 3 winning signals on DAX, EUR/JPY and USD/JPY at a loss of EUR/GBP which closed at the stop. The market is likely to remain heavily volatile on the back of high impact economic events, especially the one from the United States. I’m speaking about the US Inflation data which may drive nice trade opportunities not only in the dollar but also in gold.
Earlier today, the Greenback rose to a 13-month high against its peers but the gains remained limited over growing global trade tensions between China and the US. Moreover, the US is looking to impose fresh sanctions on Russia which may fuel safe-haven demand.
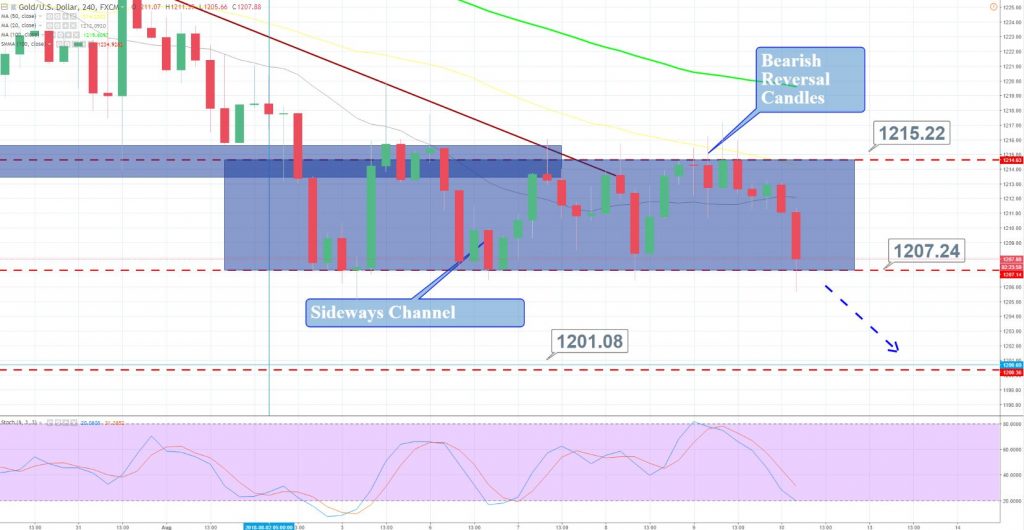
Anyway, the immediate focus is on the US CPI & Core CPI report. As we spoke earlier on Aug 10 – Economic Event Report, the economists are expecting US inflation to rise by 0.2%, up from 0.1% in the previous month. The core CPI is expected to remain unchanged at 0.2% rate. Better than expected figures will cause a bearish breakout in gold. It’s been trading in the narrow trading range of $1,207 – $1,215.

Support Resistance
1207.01 1224.59
1201.59 1230.01
1192.8 1238.8
Key Trading Level: 1215.8
Overall, the trend of the yellow metal is bearish, as you can see gold prices are trading below 100 periods moving average. Moreover, the RSI and Stochastic are also holding near 20 (below 50), signaling bearish sentiment of investors.
Let’s say, if the CPI figures disappoint, we may see a bullish reversal in gold, especially if it continues to trade above $1,207 before the news release.


