Gold peaking out descending triangle – Is it going for $1197?
I'm planning to open a sell position below $1,206 to target $1,201 and $1,197. Stay tuned to our forex signals page for latest live signals.
•
Last updated: Monday, August 13, 2018

What’s up, fellas.
Hard luck with our forex trading signal on gold. It just missed our target of $1210 by 4 pips before closing at stop loss. No worries, we may have another signal very soon. For instance, on the 4-hour chart, gold is violating the descending triangle pattern at $1206. This may lead gold prices towards $1197.
[fxml_more-topics]
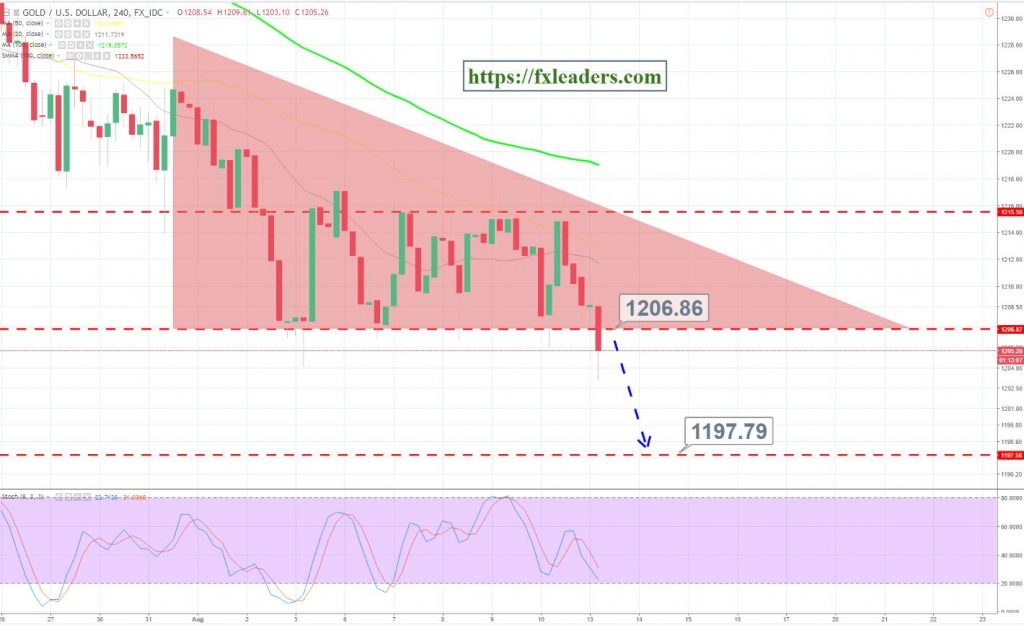
Now, I’m planning to open a sell position below $1,206 to target $1,201 and $1,197. Stay tuned to our forex signals page for latest live signals.
- Check out our free forex signals
- Follow the top economic events on FX Leaders economic calendar
- Trade better, discover more Forex Trading Strategies
- Open a FREE Trading Account
- Read our latest reviews on: Avatrade, Exness, HFM and XM
ABOUT THE AUTHOR
See More
Arslan Butt
Lead Markets Analyst – Multi-Asset (FX, Commodities, Crypto)
Arslan Butt serves as the Lead Commodities and Indices Analyst, bringing a wealth of expertise to the field. With an MBA in Behavioral Finance and active progress towards a Ph.D., Arslan possesses a deep understanding of market dynamics.
His professional journey includes a significant role as a senior analyst at a leading brokerage firm, complementing his extensive experience as a market analyst and day trader. Adept in educating others, Arslan has a commendable track record as an instructor and public speaker.
His incisive analyses, particularly within the realms of cryptocurrency and forex markets, are showcased across esteemed financial publications such as ForexCrunch, InsideBitcoins, and EconomyWatch, solidifying his reputation in the financial community.
Related Articles
Sidebar rates
Related Posts
