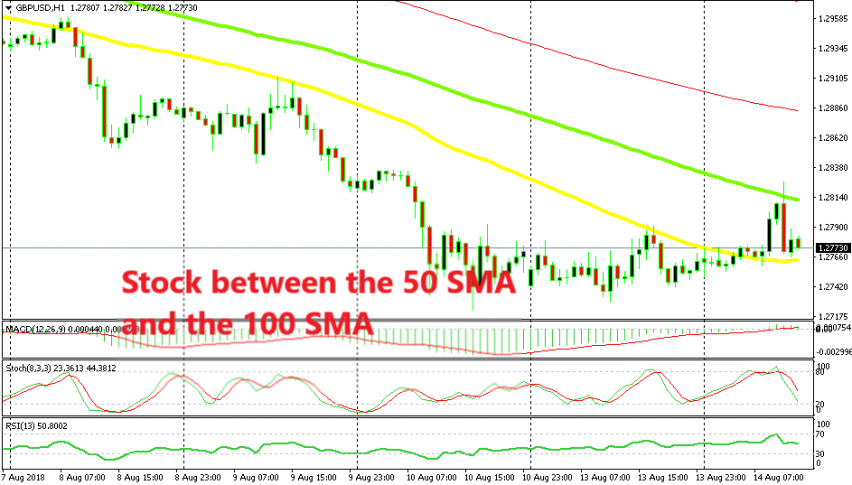
GBP/USD trading Between Two Moving Averages After the Employment Report
GBP/USD made a bullish move this morning climbing around 70 pips. Although, that move came from the USD side because other pairs were making

GBP/USD made a bullish move this morning climbing around 70 pips. Although, that move came from the USD side because other pairs were making some gains against the USD as well. The price broke above the 50 SMA (yellow) where we sold this pair yesterday. Glad I hadn’t started trading yet because I would have probably opened another sell forex signal since all sell signals at this moving average have closed in profit in the last couple of weeks.
So, this pair climbed higher today before the UK employment report was released and gave the market the idea that today’s numbers might be positive. The employment numbers weren’t bad actually. The unemployment rate declined to 4.0% from 4.2%, which brings unemployment.
The hourly output productivity increased to 1.5% in Q2 from 0.9% on Q1 so that is another positive number. But, the earnings came at 2.4% 3M/Y against 2.5% expected. This is the lowest reading since last September.
The market is really obsessed with wages now since they have been lagging behind the economic recovery in all developed economies since the 2008 global financial crisis. GBP/USD pierced the 100 SMA (green) for a moment but returned below it and then reversed down.
We opened a sell forex signal below the 100 SMA and it is going well. But, the 50 SMA has turned into support now. So, the price is currently stuck between the 50 SMA at the bottom and the 100 SMA at the top. Hopefully, the 50 SMA will go first so we can get our pips from this forex signal.

The 20 SMA has been pushing this pair lower for more than a week
The picture looks promising for the sellers if we switch to the H4 chart. The 20 SMA (grey) has caught up with the price now and it is providing resistance. Last week, it did a really good job providing resistance and pushing GBP/USD lower so that might be the case today again, fingers crossed.
- Check out our free forex signals
- Follow the top economic events on FX Leaders economic calendar
- Trade better, discover more Forex Trading Strategies
- Open a FREE Trading Account


