Gold plunges to 13 months low – Well done ABCD pattern!
Recalling our earlier update ABCD pattern in Gold, the precious metal traded exactly in line with our forecast, helping our forex trading...
Recalling our earlier update ABCD pattern in Gold, the precious metal traded exactly in line with our forecast, helping our forex trading signal secure some nice profits. On Wednesday, gold prices shifted to their lowest since January 2017 amid the stronger dollar.
Well, the U.S. dollar also jumped to its highest level in 13 months and this is something we forecast in the previous economic events report.
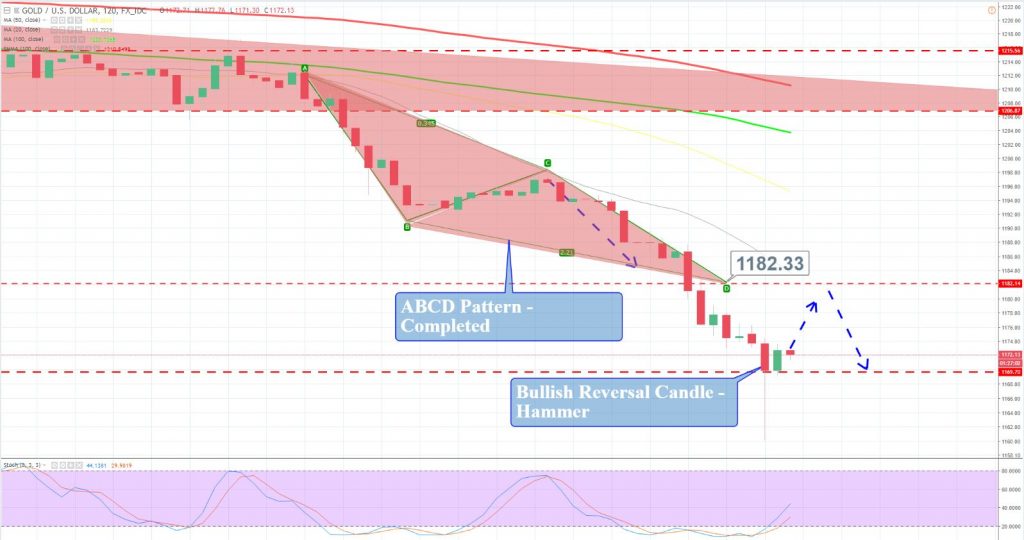
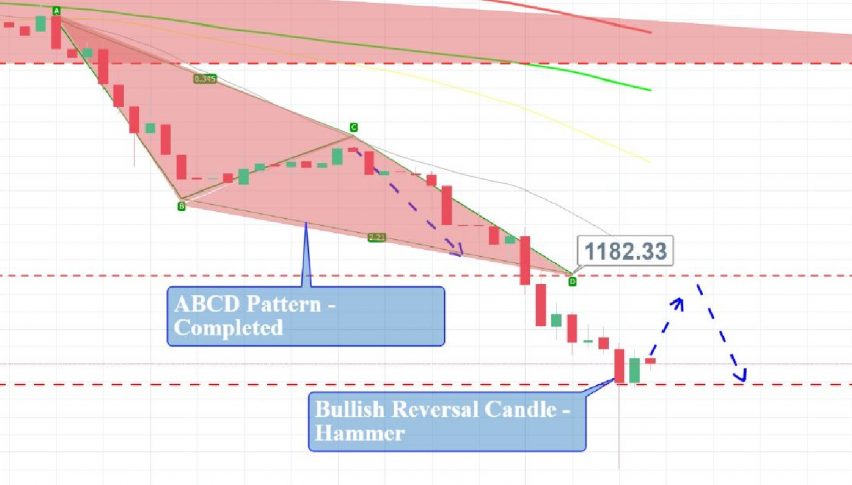
Gold – 120 Min Chart
For the moment, gold is trading near $1,173 after placing a low of $1,160. It recently has formed a sort of a hammer candle pattern on the 2-hour chart. The hammer pattern followed by a strong bearish trend often causes a bullish reversal. That being said, can we expect a bullish reversal?
I wish I could say yes, but gold is still bearish and the violation of $1,181 has opened further room for selling until $1,157 and $1,131. But since the metal is in oversold zone, we may see a bullish retracement in it until $1,181 and $1,187. Stay tuned for more updates!
- Check out our free forex signals
- Follow the top economic events on FX Leaders economic calendar
- Trade better, discover more Forex Trading Strategies
- Open a FREE Trading Account


