ABCD pattern in Gold – Is it going for $1,181?
Today during the early Asian session, gold prices slid to their lowest since January 2017, pressured as the dollar index soared to its...
•
Last updated: Wednesday, August 15, 2018
Today during the early Asian session, gold prices slid to their lowest since January 2017, pressured as the dollar index soared to its highest in 13 months. No surprises here, it’s exactly what we suggested in our previous update Aug 14 – Economic Event Brief.
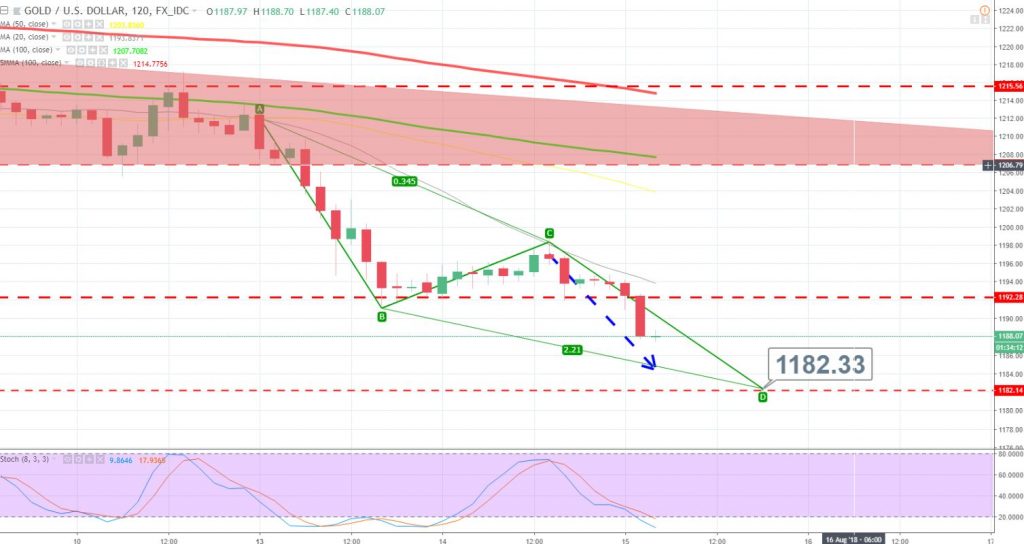
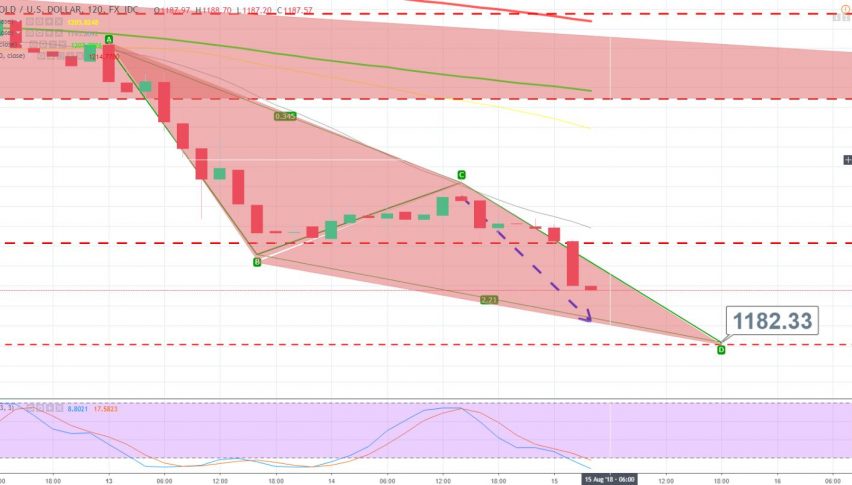
Gold – 2 Hour Chart
Gold seems to form an ABCD pattern on the 2-hour chart. As you can see, it has complete 38.2% retracement near $1,198 and has also violated the major support zone of $1,192.
The recent bearish engulfing candle is suggesting a strong bearish sentiment of traders and it has nice chances to go after $1,187 and $1,181.
- Check out our free forex signals
- Follow the top economic events on FX Leaders economic calendar
- Trade better, discover more Forex Trading Strategies
- Open a FREE Trading Account
- Read our latest reviews on: Avatrade, Exness, HFM and XM
ABOUT THE AUTHOR
See More
Arslan Butt
Lead Markets Analyst – Multi-Asset (FX, Commodities, Crypto)
Arslan Butt serves as the Lead Commodities and Indices Analyst, bringing a wealth of expertise to the field. With an MBA in Behavioral Finance and active progress towards a Ph.D., Arslan possesses a deep understanding of market dynamics.
His professional journey includes a significant role as a senior analyst at a leading brokerage firm, complementing his extensive experience as a market analyst and day trader. Adept in educating others, Arslan has a commendable track record as an instructor and public speaker.
His incisive analyses, particularly within the realms of cryptocurrency and forex markets, are showcased across esteemed financial publications such as ForexCrunch, InsideBitcoins, and EconomyWatch, solidifying his reputation in the financial community.
Related Articles


Sidebar rates
Related Posts
