Selling the Pullback in USD/JPY
With the situation in Turkey still aggravated, the safe haven assets have been receiving some very decent bids recently. Even Gold...

With the situation in Turkey still aggravated, safe-haven assets have been receiving some very decent bids recently. Even Gold that used to be on a really strong downtrend, which is still on by the way, is making a decent retrace. Although, that looks like a good opportunity to look for a selling place there, but we will take a better look at it soon.
The Swiss Franc and the Yen have also been in demand in recent weeks. But, USD/JPY has been making a retrace during the Asian session which has taken this pair higher and thus persuaded us to open a sell forex signal in this pair.
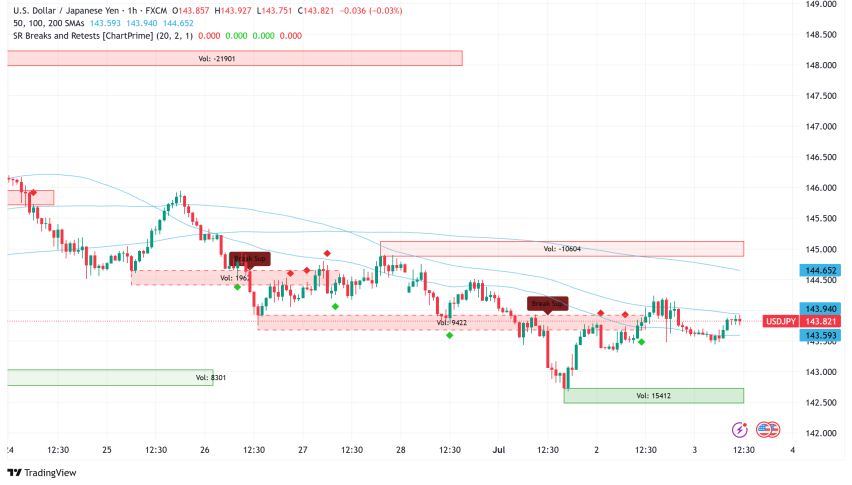
As you can see from the hourly chart above, USD/JPY has climbed around 25-30 pips this morning. But it has run into the 50 SMA (yellow) a couple of hours ago and it has been hesitating to make any further bullish claims since then.
It seems as the 50 SMA is providing solid resistance at the moment. The stochastic indicator is also overbought on this timeframe chart, which means that this pair is overbought and a bearish reverse should follow, according to the forex textbook. So, these are the reasons for selling USD/JPY. Now let’s give it some time to make its decision.
- Check out our free forex signals
- Follow the top economic events on FX Leaders economic calendar
- Trade better, discover more Forex Trading Strategies
- Open a FREE Trading Account