Bearish Break of the 20 SMA on EUR/JPY, but the 50 SMA Holds the Line
EUR/JPY was trading in a pretty bullish trend last week. The indicator which was keeping the trend intact and pushing it further up was...

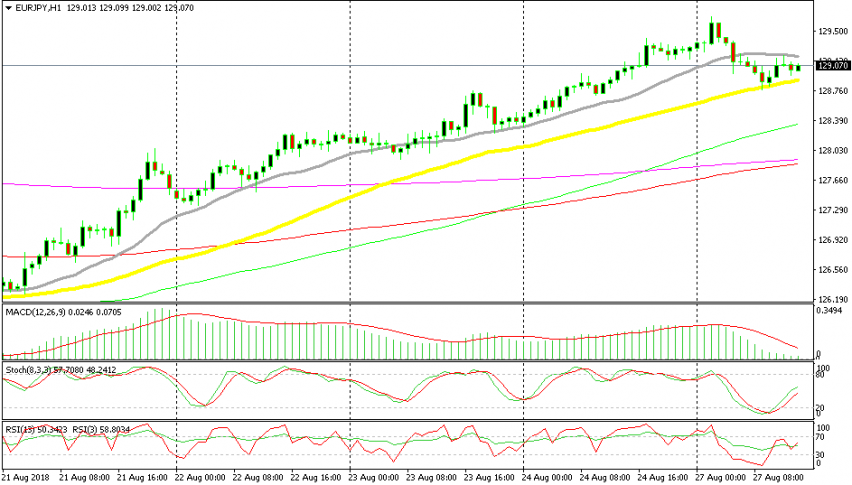
EUR/JPY was trading in a pretty bullish trend last week. The indicator which was keeping the trend intact and pushing it further up was the 20 SMA (grey) on the H1 chart. The price found support at that moving average many times as it retraced lower and a bullish move followed every pullback.
Today though, the sellers gained confidence unexpectedly and the 20 SMA was finally broken. The Euro took a bearish turn during the Asian session which helped the sellers, but the decisive move came from the JPY. I don’t know if this was a run for safe havens because the JPY and particularly Gold have found some solid bids today, but the CHF seems a bit soft.
Anyway, the 20 SMA has finally been broken but another moving average comes to rescue for EUR/JPY buyers. The 50 SMA (yellow) provided support this morning so this moving average has turned into the trend defining indicator today.
The price bounced off of it and moved higher, but the 20 SMA turned into resistance now. So now EUR/JPY is stuck between the 50 SMA at the bottom and the 20 SMA at the top. Well, the uptrend is still in place and I’m thinking of going long on this pair if the price touches the 50 SMA again and the 50 SMA holds.

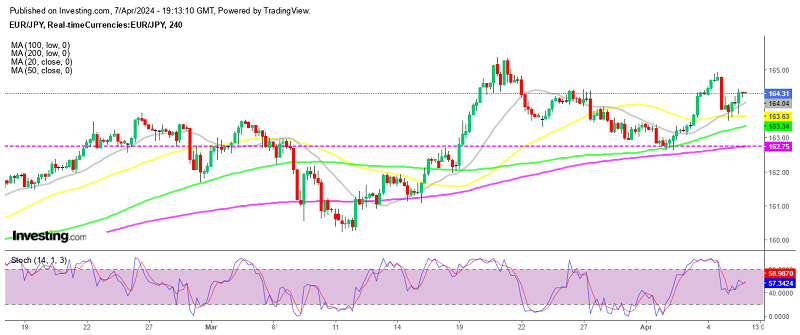
The 200 SMA has turned into support now
I hold the bullish view in this pair because the picture looks bullish on the H4 chart as well. EUR/JPY broke above the 200 SMA (purple) on this time-frame chart last week and it has retraced lower today. But, the 200 SMA (purple) has reversed the game and is providing support here at the moment. The previous candlestick closed as a doji which is a bullish reversal signal after a retrace down.
- Check out our free forex signals
- Follow the top economic events on FX Leaders economic calendar
- Trade better, discover more Forex Trading Strategies
- Open a FREE Trading Account


