What Was Resistance in Gold XAU Now Turns Into Support
Gold XAU turned bearish in April after it failed to break above the 100 SMA on the monthly chart. Since then, it’s been one way traffic...
Gold XAU turned bearish in April after it failed to break above the 100 SMA on the monthly chart. Since then, it’s been one way traffic and Gold has lost more than $200 during this time. Bounces have been really minimal, but in the last two weeks Gold has been putting up a brave fight.
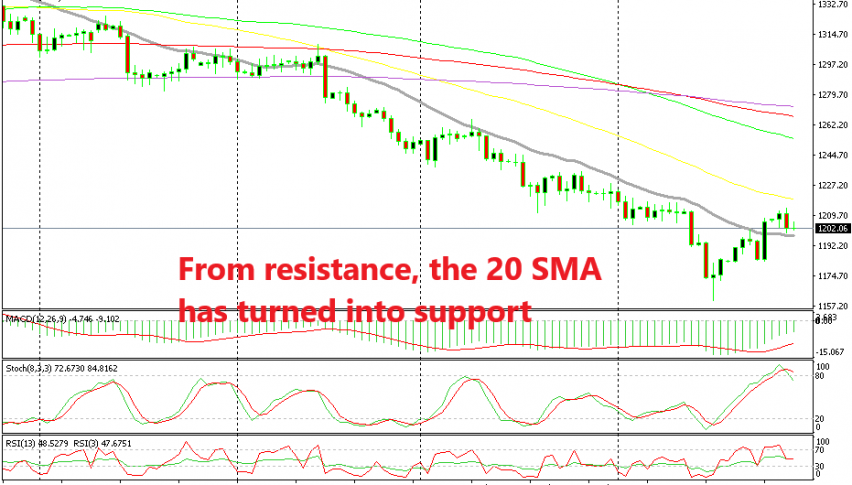
As you can see from the daily chart above, Gold XAU formed a doji last week which is a reversing signal. We spotted that signal but didn’t take the trade because the downtrend had been so strong and we didn’t want to catch a falling knife.
But, the reverse happened and the indicator which has been keeping the downtrend intact for months has now been broken. That indicator is the 20 SM (grey). The sellers had another try to push lower as the price touched the 20 SMA last week, but eventually the buyers overcame the sellers last Friday and the 20 SMA finally gave way.
Now, this moving average has turned into support as these indicators usually do. I don’t know if Gold will resume the bearish trend and break below the 20 SMA again but this is the situation right now. If the price moves below the 20 SMA then the downtrend is likely on again. If not, then we might see a decent pullback higher which might last for a few weeks.
- Check out our free forex signals
- Follow the top economic events on FX Leaders economic calendar
- Trade better, discover more Forex Trading Strategies
- Open a FREE Trading Account
- Read our latest reviews on: Avatrade, Exness, HFM and XM
Related Articles

Sidebar rates
Related Posts
