The Pullback Is Over for EUR/USD
Last week we highlighted the pullback in EUR/USD as this pair was retracing higher. The retrace up which was pretty quick, as quick as...
Last week we highlighted the pullback in EUR/USD as this pair was retracing higher. The retrace up was pretty quick, as quick as the decline in the previous few weeks. EUR/USD climbed from 1.13 to 1.1730s in a few weeks, erasing the losses of the previous weeks. So, it was a bit scary going against such a move, despite the bigger trend being down.
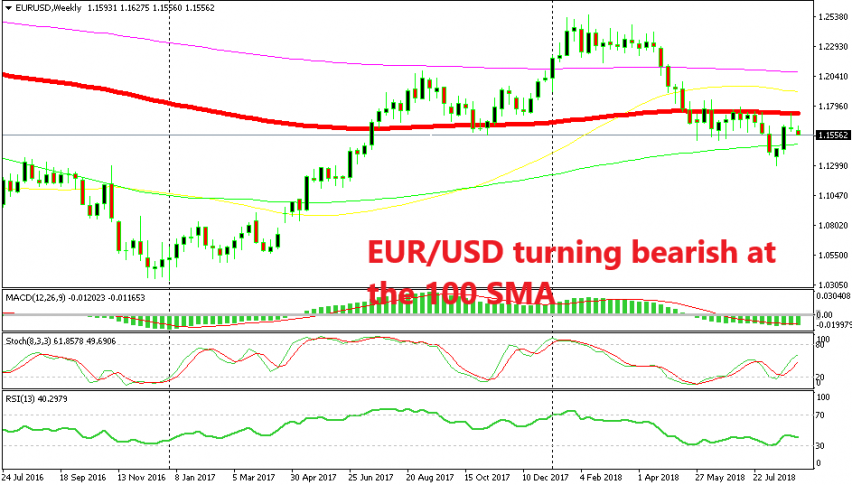
Last week when we posted the update about the bigger charts in EUR/USD, this pair was trading just below the 100 SMA (red). I highlighted this moving average because it had provided support back in November last year and it turned into resistance this year after it was broken.
So, there was a pretty good chance that this moving average would turn into resistance now. The area above 1.17 is also a major support and resistance area since it provided strong resistance back in August 2015.
Although, the bearish reversal didn’t take form until the end of last week. Last week, the 100 SMA rejected the buyers and the weekly candlestick closed as a doji/pin which is a reversing signal.
Now, the picture is clearer. Stochastic is not overbought yet, but it has moved up high enough to support a bearish move, which seems like is coming. This week has already started pretty bearish for EUR/USD and after a pin in the previous week, it seems that this pair is resuming the bearish trend. Let’s see if 1.13 will be broken this time.
- Check out our free forex signals
- Follow the top economic events on FX Leaders economic calendar
- Trade better, discover more Forex Trading Strategies
- Open a FREE Trading Account


