NZD/USD is Taking its Time but the Bearish Reversal is Building up
Yesterday we opened a forex signal in NZD/USD. We decided to go short on this pair as it was climbing higher in what seemed a retrace of...

Yesterday we opened a forex signal in NZD/USD. We decided to go short on this pair as it was climbing higher in what seemed to be a retrace of the larger downtrend that NZD/USD has been in during the last five months.
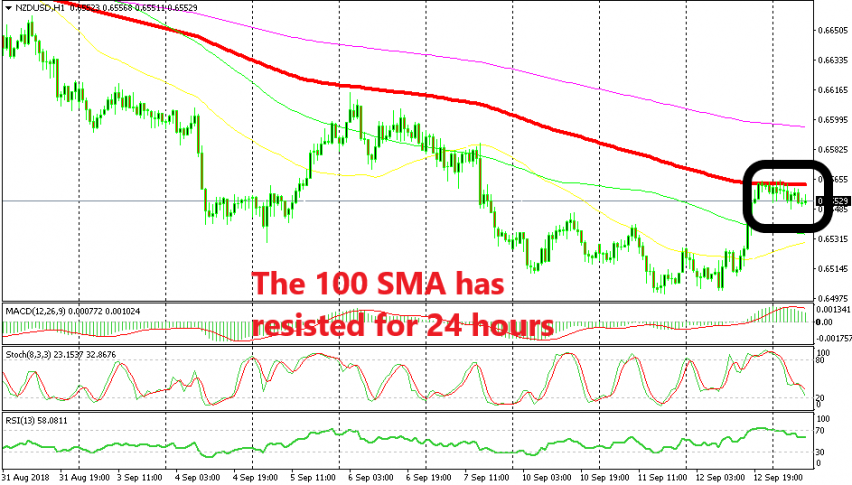
The reason why we decided to sell this pair can be found on the H1 chart. As you can see from the chart above, NZD/USD reached the 100 SMA (red) on this timeframe chart yesterday and it started having trouble at that moving average. The buyers couldn’t push the price above it and they haven’t been able to break it today either.
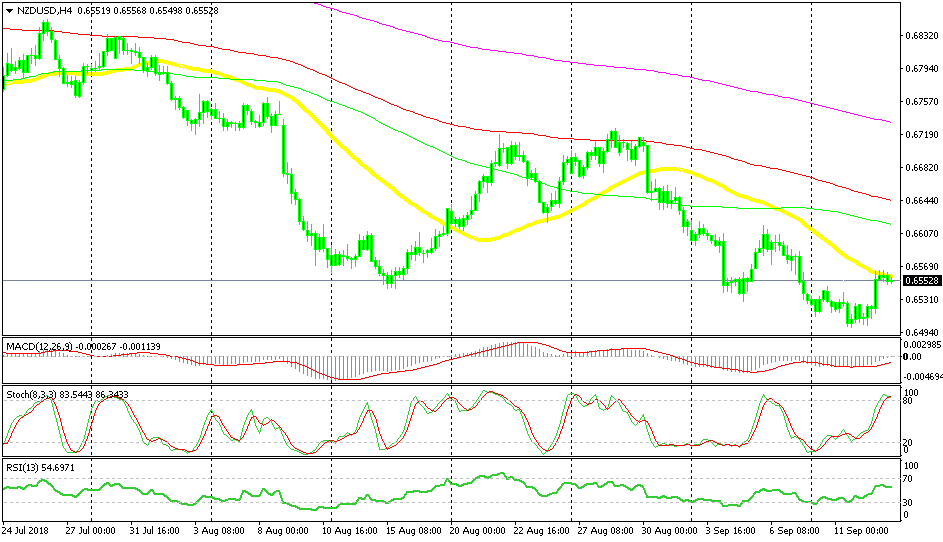
The stochastic indicator was severely overbought which meant that the retrace up was complete. Today, stochastic is also overbought on the H4 chart which gives sellers one more reason to hold on to their trades.

The 50 SMA has now caught up with the price
We can see on the H4 chart that the 50 SMA (yellow) has also caught up with the price now, which is another reason to stay short, given that this moving average has been a strong support and resistance indicator.
The stochastic is now starting to turn lower on the H4 chart and the last few H4 candlesticks looks sort of bearish. Besides, while other risk currencies are still making gains against the USD, the NZD is not making new highs. Instead, it is slowly slipping lower which is a sign of weakness. When the other risk currencies will reverse, NZD/USD will be the first to fall down.
- Check out our free forex signals
- Follow the top economic events on FX Leaders economic calendar
- Trade better, discover more Forex Trading Strategies
- Open a FREE Trading Account


