Quick Update on Gold Signal – Ascending Triangle Pattern in Play
Gold has formed an ascending triangle pattern which is providing a strong resistance to gold near $1,206. I can't say when to expect a...

Gold prices continue to trade sideways, after rising in the previous session, as the dollar weakened amid easing Sino-U.S. trade anxieties and traders waiting for the U.S. Federal Reserve meeting next week. The higher rate of interest depresses the demand for non-interest yielding assets such as gold and consequently boosts the demand for the dollar. That is why we are seeing a muted behavior of gold despite the safe-haven appeal.
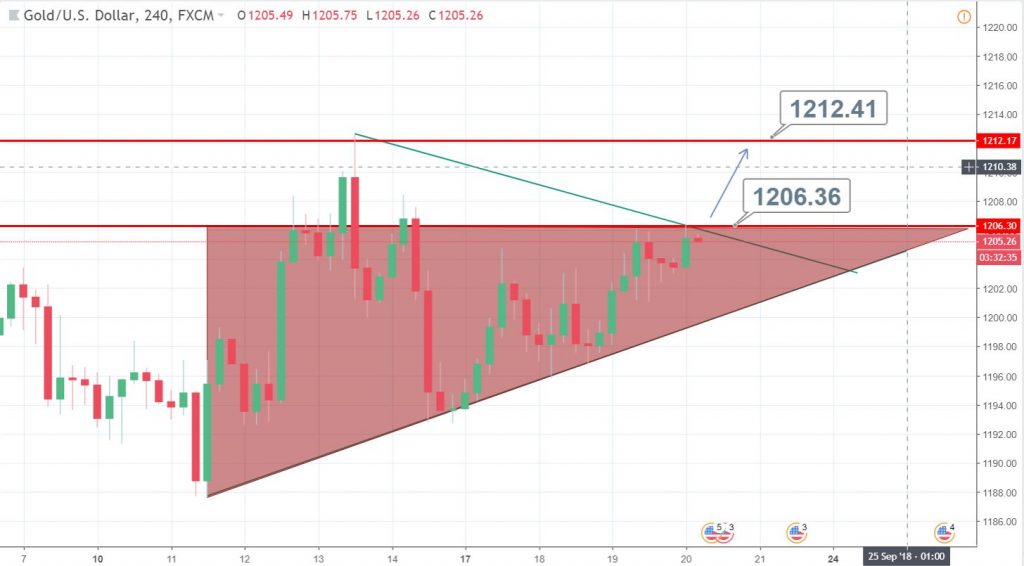
Gold – 4 Hour Chart
Gold has formed an ascending triangle pattern which is providing a strong resistance to gold near $1,206. I can’t say when to expect a breakout as the U.S. economy isn’t expected to release any major data today.
Support Resistance
1201.14 1206.61
1198.26 1209.2
1192.8 1214.66
Key Trading Level: 1203.73
Anyhow, the bullish breakout of $1,206 can offer us an opportunity to go long for $1,212. We just closed our earlier buying signal as gold is facing a hard time breaking the $1,206 resistance. The yellow metal can drop to $1,201 and $1,197, if it continues to hold below $1,206.
Good luck and keep following for more updates!
- Check out our free forex signals
- Follow the top economic events on FX Leaders economic calendar
- Trade better, discover more Forex Trading Strategies
- Open a FREE Trading Account


