WTI Crude Oil – Ascending Triangle Pattern Doing Well!


During the early Asian session, crude oil jumped 2% as U.S. sanctions curbed Iranian crude exports, tightening global supply. The Middle East controlled the Organization of the Petroleum Exporting Countries and the top producer Russia are discussing boosting output to counter sinking supply from Iran. Although they haven’t come to an agreement yet, the sentiments can place a bearish impact on oil.
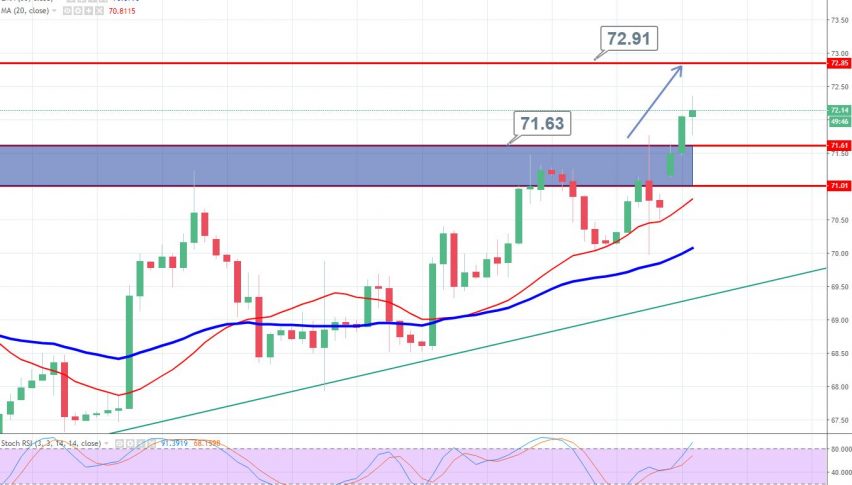
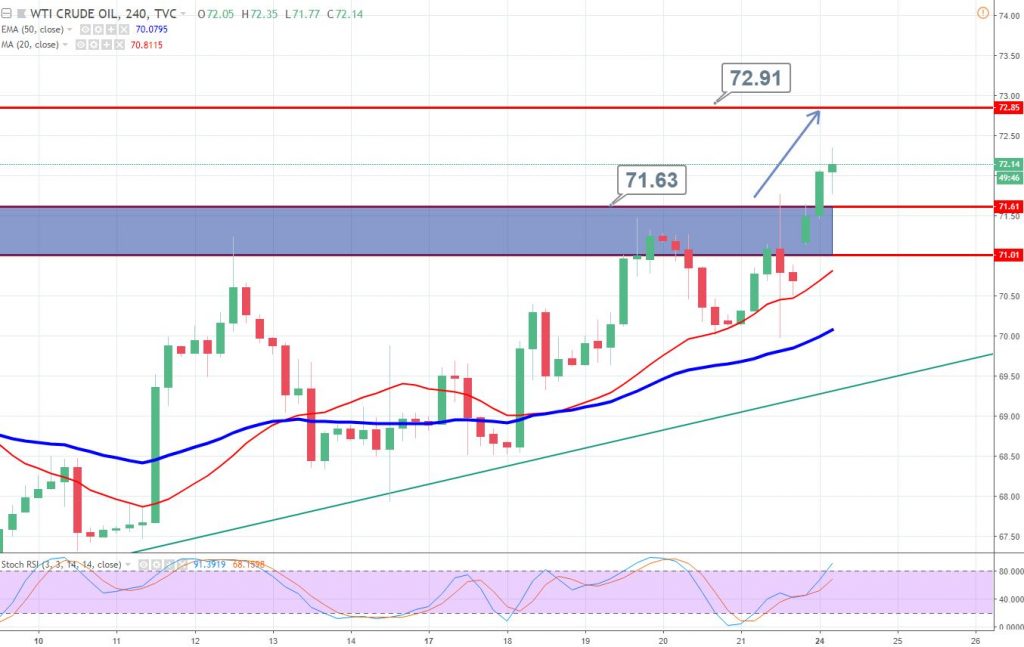
Technically, crude oil has traded exactly in line with our forecast. The black crack has violated the double top resistance level of $71.60. The immediate resistance is likely to be at $72.85.
Support Resistance
68.74 72.18
66.8 73.69
63.35 77.13
Key Trading Level: 70.24
WTI crude oil seems to form three white soldiers on the 4 – hour chart which is signaling the bullish bias of traders. In addition, the leading and lagging indicators like RSI and 50 periods EMA are also indicating the bullish trend. Today, the idea is to stay bullish above $71.65 to target $72.85. Good luck!