Dogecoin Price Prediction: DOGE Surges to $0.160, Eyes $0.195 Amid Bullish Breakout
Today, Dogecoin (DOGE) is priced at $0.160256, marking a 1.20% increase over the past 24 hours. With a substantial trading volume
Today, Dogecoin (DOGE) is priced at $0.160256, marking a 1.20% increase over the past 24 hours.
With a substantial trading volume of $1,571,897,491, Dogecoin’s market dynamics are notable, as evidenced by its current market capitalization of $23.07 billion, ranking it eighth on CoinMarketCap. The coin’s circulating supply is at 143,976,936,384 DOGE.
Technical Analysis
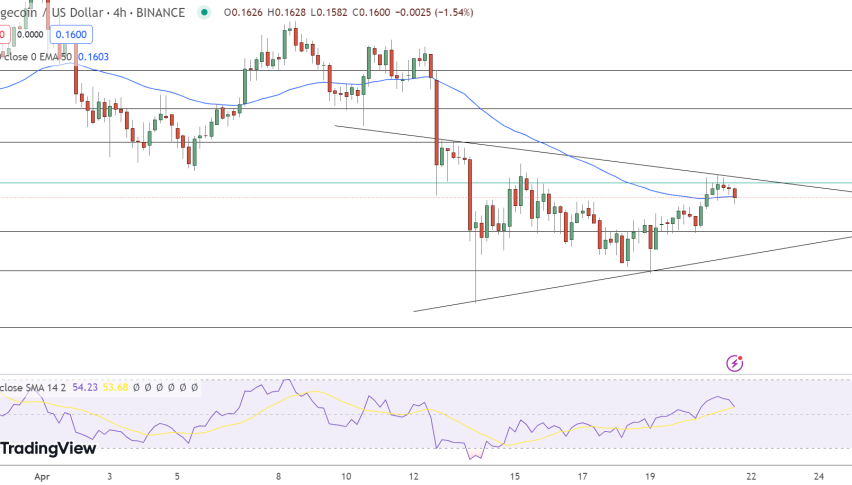
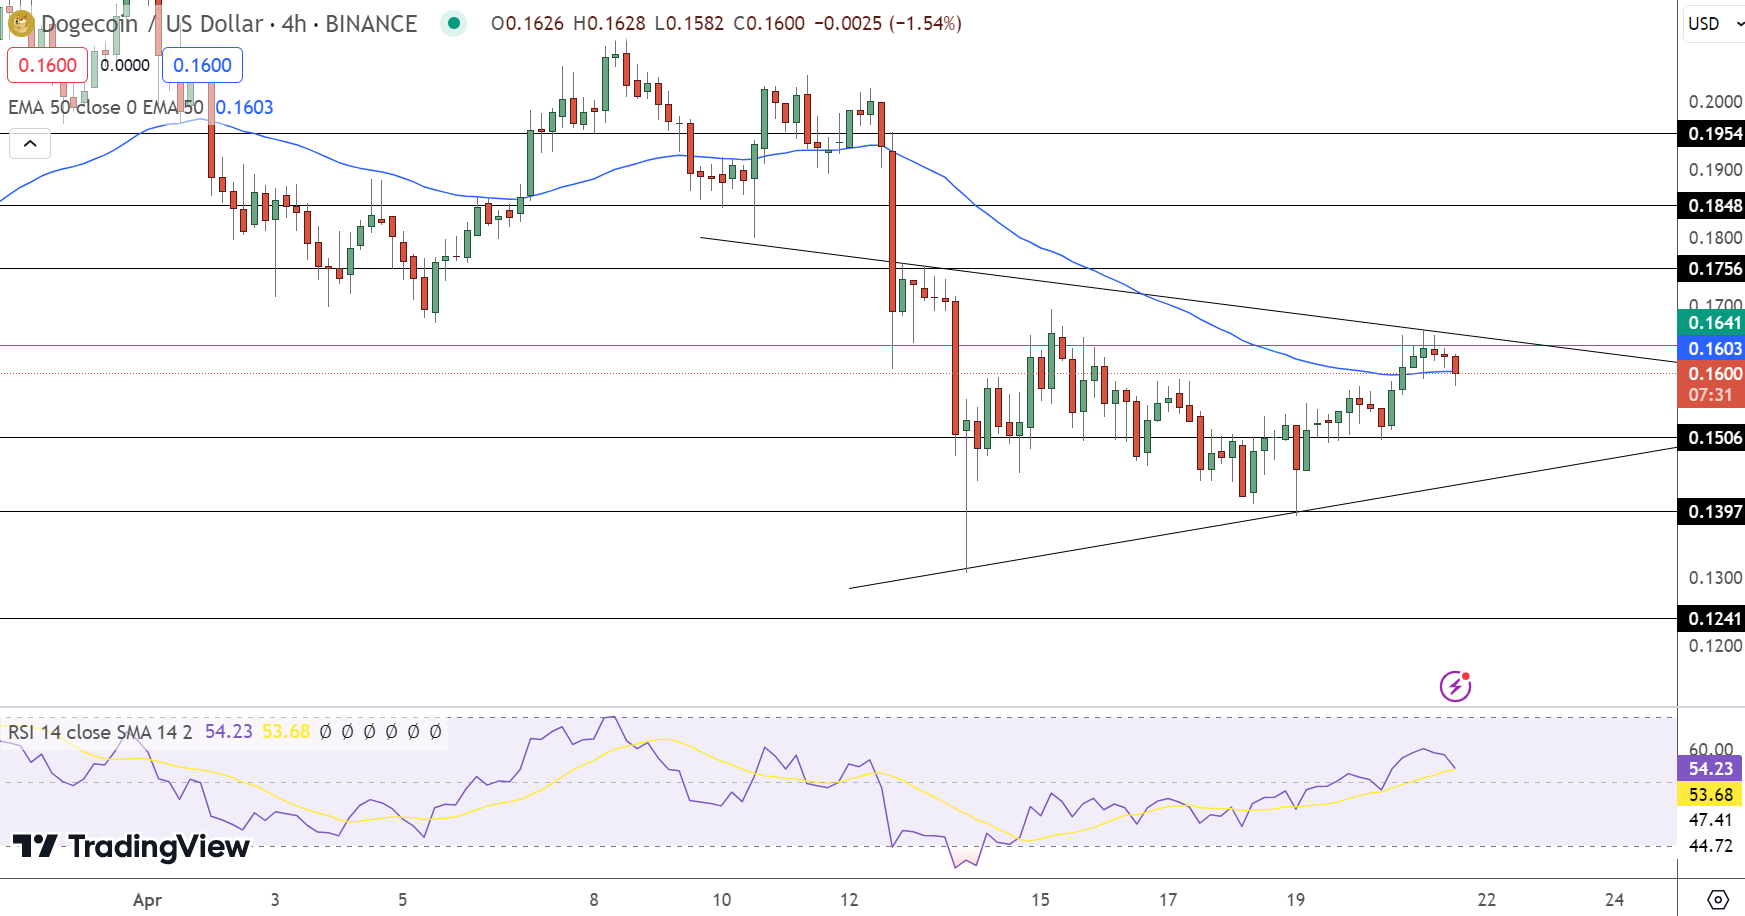
Dogecoin is currently trading just below the pivotal $0.1641 level. This pivot point is crucial as it serves as both a psychological and technical threshold. Immediate resistance levels are identified at $0.1756, $0.1848, and $0.1954, which need to be surpassed to confirm a bullish continuation.
On the flip side, support levels are established at $0.1506, $0.1397, and $0.1241. These marks represent potential bounce-back points during pullbacks and are critical in maintaining the bullish structure.
The Relative Strength Index (RSI) stands at 54, suggesting a neutral market sentiment that leans slightly towards bullish. This is supported by the positioning of the 50-day Exponential Moving Average (EMA) at $0.1603, almost aligned with the current price, indicating stability in the current trend.
Market Patterns and Indicators
A key observation on the 4-hour chart shows a potential double-top pattern at $0.1640, a resistance level that coincides with the pivot point. This pattern typically signals a bearish reversal, adding a layer of caution to the immediate bullish outlook.
However, the proximity of the 50 EMA and the moderately positive RSI tilt the bias towards the potential upside, should Dogecoin breach the $0.1640 resistance.
Conclusion
The technical outlook for Dogecoin remains cautiously optimistic, with a clear demarcation at the $0.1641 level. A sustained move above this level could ignite further buying interest, propelling DOGE towards higher resistance levels.
Conversely, failure to uphold this level could trigger a sell-off, pushing prices towards established support levels. Investors and traders should monitor these key indicators closely, as a break in either direction will likely dictate the short-term market trajectory for Dogecoin.
- Check out our free forex signals
- Follow the top economic events on FX Leaders economic calendar
- Trade better, discover more Forex Trading Strategies
- Open a FREE Trading Account
- Read our latest reviews on: Avatrade, Exness, HFM and XM
Related Articles


Sidebar rates
Related Posts
