Gold Tries to Reverse Up but Fails at the 20 SMA
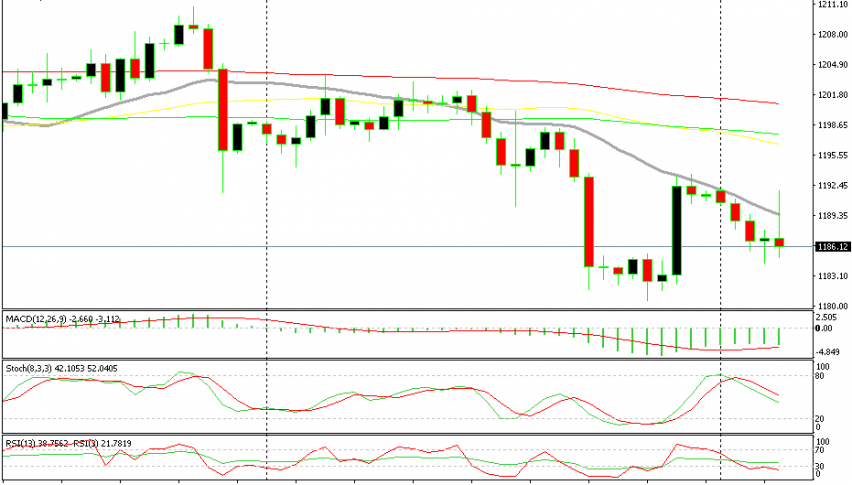
Gold has been on a bearish trend lately but it made a bullish attempt this morning. the 20 SMA didn't allow that and Gold has resumed the...

Last week we had a long term sell signal in Gold which I opened the previous week as Gold was retracing higher. Gold was finding resistance at the 50 SMA on the daily chart back then and it was oversold too and that chart time frame, so we decided to sell.
That signal went petty well as Gold dived hard by the end of the previous week and again at the end of last week. We booked profit a bit too early since we could have let that signal run for another 100 pips, but we did get around 100 pips from that signal.
Anyway, Gold made a bullish reversal on Friday but the 20 SMA (grey) held the ground pretty well and it pushed Gold lower again today during the Asian session. In the European session, Gold buyers decided to have another try at the upside after the previous H4 candlestick formed a pin which is a reversing signal.
But the 20 SMA got in their way once again. It provided resistance once again and the buyers closed their trades right there. Now, the stochastic indicator is headed down again and so is the price, so Gold is on a bearish trend at the moment, so if you want to trade Gold, the downside is a bit safer right now.
- Check out our free forex signals
- Follow the top economic events on FX Leaders economic calendar
- Trade better, discover more Forex Trading Strategies
- Open a FREE Trading Account


