

EUR/CHF has turned bearish in the last few days after it failed to break above the 100 SMA on the daily chart. It lost around 150 pips in the process as the attention turned on safe havens over deteriorating market sentiment.
Another sign of the negative sentiment in financial markets at the moment can be observed in stocks which continue to make new lows, although they are retracing higher today. But, this retrace seems like a good opportunity to get in on the downtrend and go with the flow.
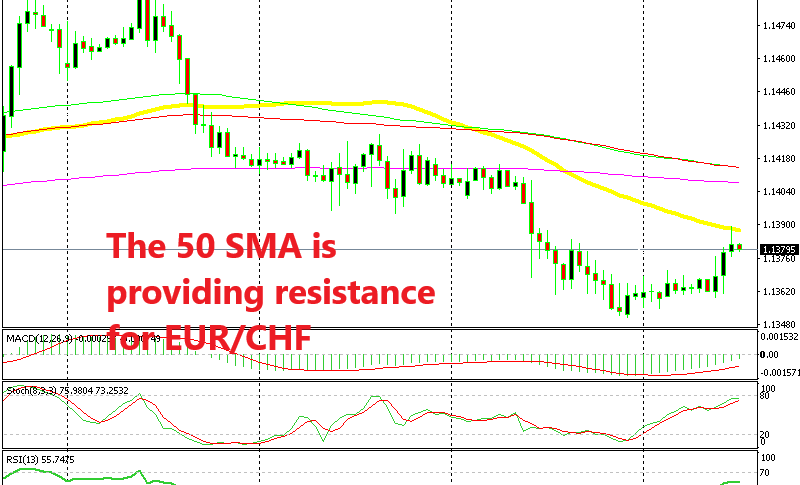
While stocks haven’t completed the retrace higher yet, it seems like EUR/CHF has. This forex pair has completed the retrace on the H1 chart as the stochastic indicator shows. Stochastic has just become overbought on this time-frame.
The previous candlestick looks like an upside-down hammer which is a reversing signal after the bullish retrace. Besides that, the 50 SMA (yellow) is providing resistance on top, so it looks like EUR/CHF might reverse back down soon.

The 100 SMA has turned into resistance on the H4 chart
Switching to the H4 chart, we see that the stochastic indicator is not close to being overbought, which means that there’s a lot of room to move higher. But, the 100 SMA (red) thinks otherwise.
It used to be support for a few weeks, but now that it has been broken, the 100 SMA has turned into resistance. So, even though the H4 chart is not overbought yet, the picture here looks more bearish than bullish. We just opened a sell forex signal here, so fingers crossed.