A Quick Trade Off the 100 SMA in EUR/USD
The USD has been on a strong uptrend last week and EUR/USD lost more than 200 pips from top to bottom. But during the US session last Friday, EUR/USD made a reversal which came from the USD side.
I’m not sure about the reasons because the US economic data wasn’t particularly bad on Friday and it wasn’t even that important. Perhaps, forex traders just positioned themselves ahead of the weekend in anticipation for a breakthrough in the Brexit process or the situation in Italy.
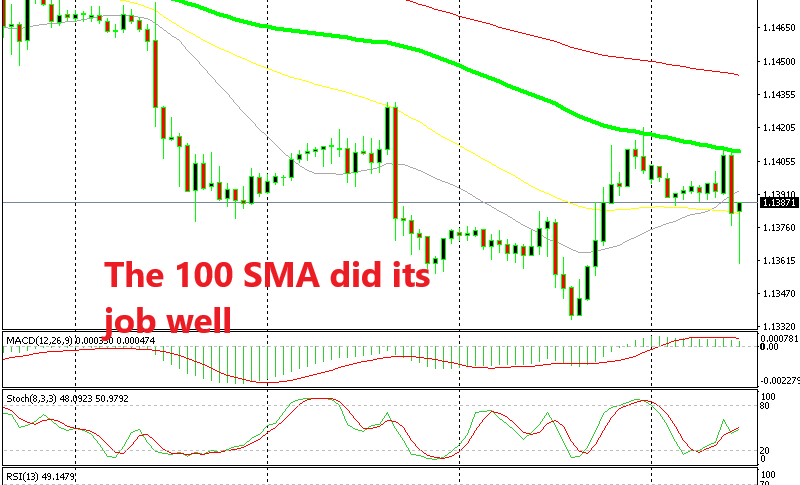
The 100 SMA (green) stopped the reversal though in the evening that day, as you can see from the H1 chart above. EUR/USD slipped a bit lower during the Asian session today, but the buyers had another try at the upside this morning.
Again, the 100 SMA survived and stopped the bullish move. This was a sign that the 100 SMA wasn’t going to let go, so we decided to open a sell forex signal.

The 20 SMA has provided solid resistance in the last week
Switching to the H4 chart, we see that the 20 SMA here, comes at the same level as the 100 SMA on the H1 chart. On this time-frame, the stochastic indicator was almost overbought so it convinced us that a reverse down was coming.
After all, nothing has changed regarding fundamentals. So, that’s what we did and, an hour later, our signal hit the take profit target. That was an easy trade.


