Gold Awaits Breakout – It’s an Ascending Triangle this Time!
On the 2- hour chart, gold is testing $1,232 probably for the sixth time since Oct 18 and now it seems to violate this level as bears seem..
Despite the volatile session, gold prices are stuck in a narrowly mixed trading range of $1,227 – $1,238 as worries over US corporate earnings and a slowdown in global economic growth pressured Asian shares. This week, the investor focus is likely to be on the US non-farm payroll and unemployment rate which are due on Friday. In the meantime, it will be nice to trade the technical side of the market. Check out a quick trade plan for today…
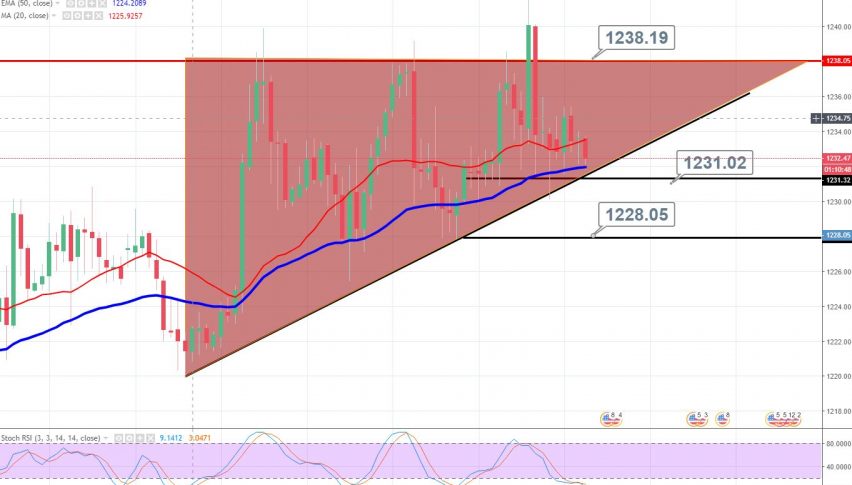
GOLD Technical Analysis – Ascending Triangle Pattern
On the 2- hour chart, gold is testing $1,232 probably for the sixth time since October 18 and now it seems to violate this level as bears seem to dominate the market.
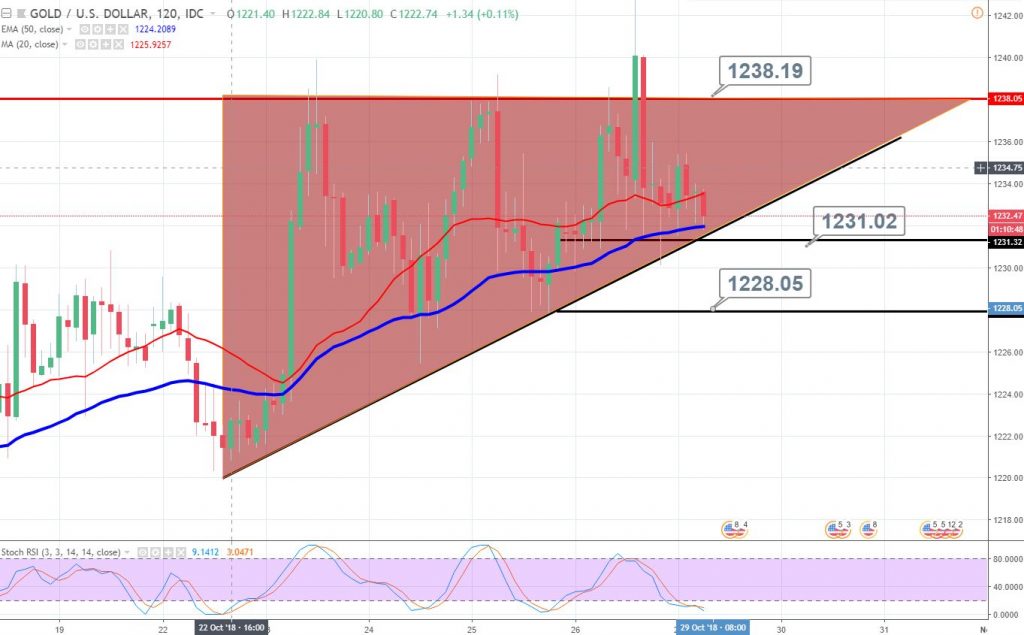
The yellow metal is holding below a solid resistance level of $1,238 which is extended by an ascending triangle pattern. These patterns typically break upward, but the 20 & 50 periods EMA are giving an opposite view.
Support Resistance
1228.39 1240.69
1223.65 1248.25
1211.35 1260.55
Key Trading Level: 1235.95
Market Sentiment
Weekly – Strong Buy
Daily – Buy
Hourly – Bearish
GOLD – XAU/USD – Trading Idea
It will be nice to stay bearish below $1,233 with a stop above $1,236 and a take profit of $1,229 and $1,227. Good luck!
- Check out our free forex signals
- Follow the top economic events on FX Leaders economic calendar
- Trade better, discover more Forex Trading Strategies
- Open a FREE Trading Account