Gold Begins the Bearish Reversal After the Retrace Higher
Gold has retraced higher for more than a month. But, the retrace seems complete now and the bearish trend is about to resume.
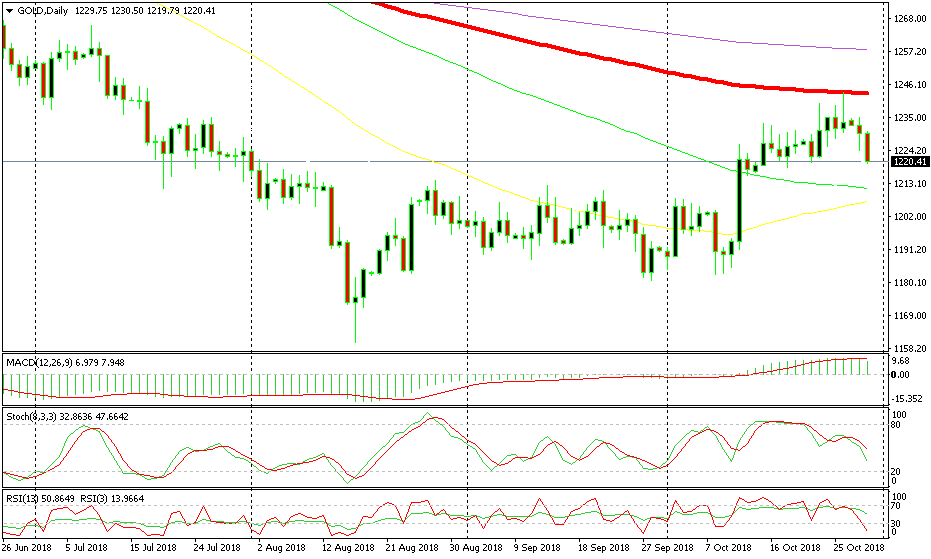
I highlighted the larger picture in GOLD a few times in the last few weeks, as the buyers were pushing the price up. The sentiment turned negative during September and October and as a result, safe haven assets received some strong bids. So, Gold made a decent bullish retrace for several weeks.
But, the bullish momentum was wearing down as we approached the 200 SMA on the monthly chart. As you can see on the weekly chart above, the last two bullish candlesticks in the last two weeks were smaller than the first two bullish candlesticks. This means that the buyers were losing strength.
Last week, Gold pushed above the 200 SMA (purple) but eventually, it closed below. Last week’s candlestick also closed as a morning star which is a reversing signal, although not as strong as a doji or a pin. The stochastic indicator became overbought on that time-frame and it is now turning down, so the retrace higher seems complete and a bearish reversal seems to be beginning now. After all, the major trend is still bearish.
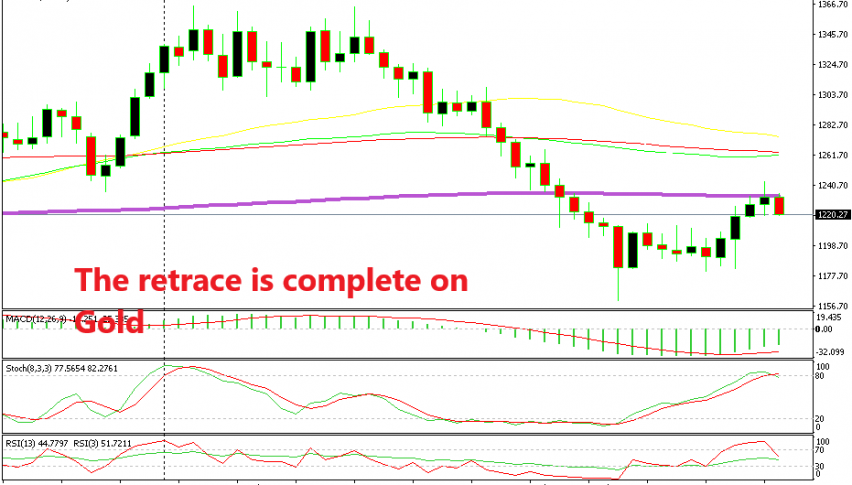
Gold started reversing after kissing the 100 SMA
Switching to the H1 chart, we see that here it is the 100 SMA (red) which has been providing resistance. The price just kissed it lightly on Thursday last week and then it started reversing down. That day’s candlestick closed as an upside-down hammer which is another reversing signal.
Since then, all the following candlesticks have been bearish. So, the reverse has already started on the daily Gold chart.
I was thinking about selling Gold yesterday but refrained. Although, I will try to sell it if I see Gold pushing higher one last time at $1,230. The risk/reward ratio justifies the trade with a stop above the 100 daily SMA.
- Check out our free forex signals
- Follow the top economic events on FX Leaders economic calendar
- Trade better, discover more Forex Trading Strategies
- Open a FREE Trading Account