Moving Averages Keep Pushing EUR/USD Down
EUR/USD has been pushing lower and the moving averages are helping the cause of the bears on the H1 and H4 charts.
[[EUR/USD]] has turned bearish since the end of September. We saw a pullback higher by the middle of this month, but the downtrend resumed again and the sellers resumed control. They have been in total control since then, but the 1.13 support level remains.
This level has provided resistance during 2016 and it has now turned into support. This was the low back in August this year and that’s the level for the buyers to break in the near term. The buyers have the technicals on their side by the way.
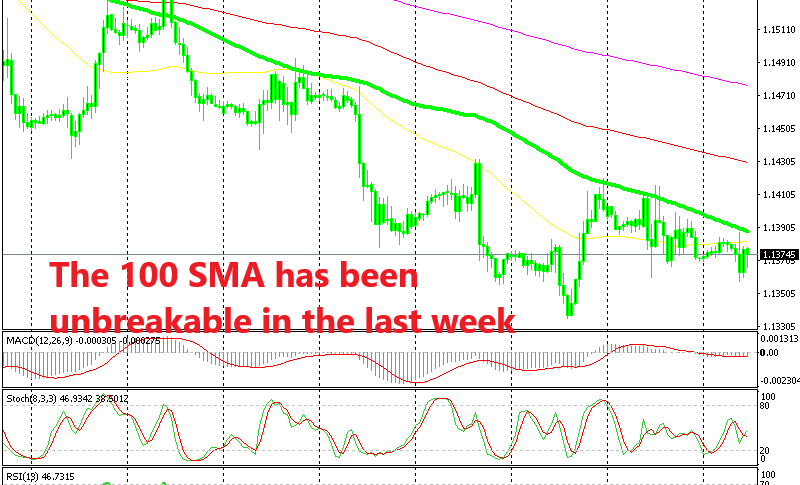
Looking at the H1 chart above, we see that the 100 SMA (green) is helping the sellers push the price down. It provided resistance for EUR/USD during the first leg of this downtrend in September and it is providing resistance again now that the downtrend has resumed again.
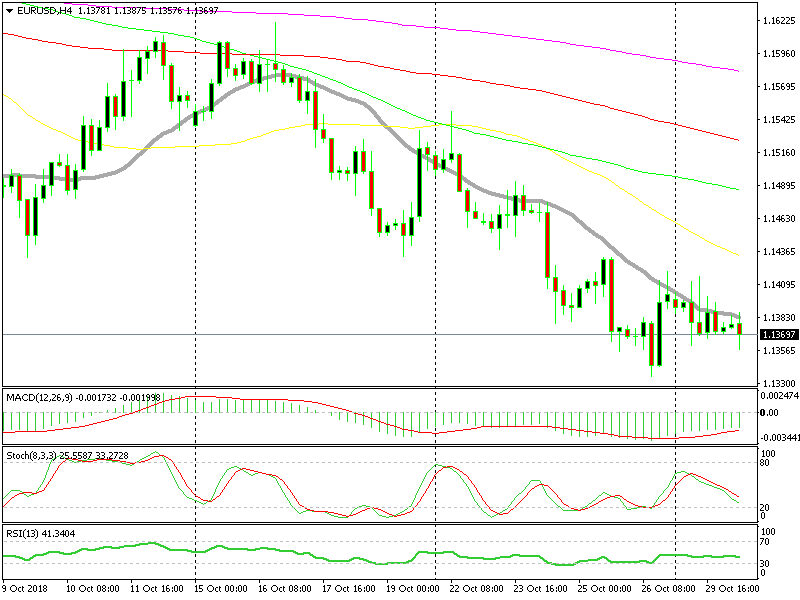
On the H4 chart, we have the 20 SMA doing the pushing lower
If we switch to the H4 chart, we see that here it is the 20 SMA (grey) which is providing resistance. It is pushing this forex pair down. There have been a few piercings above the 100 SMA but the price has returned below it without being able to close an H4 candlestick above.
So, EUR/USD is being pushed lower by moving averages on the H1 and H4 charts. Now the price is close to these moving averages again, but it is also close to the 1.13 level and looks like we are heading down there. But, don’t rule out a push higher again above the moving averages before the next leg of the downtrend resumes.
- Check out our free forex signals
- Follow the top economic events on FX Leaders economic calendar
- Trade better, discover more Forex Trading Strategies
- Open a FREE Trading Account


