Bitcoin Makes A Bullish Move But the 50 SMA Tops It Up
Bitcoin has made a bullish move over the weekend, but the 50 SMA has now turned into resistance.

Bitcoin and other cryptocurrencies made a bearish move last week. I can’t remember the reason why, but I think it was some big hedge fund guy saying that Bitcoin is the mother and father of all scams. As a result, Bitoin fell from $6,400 to around $6,200.
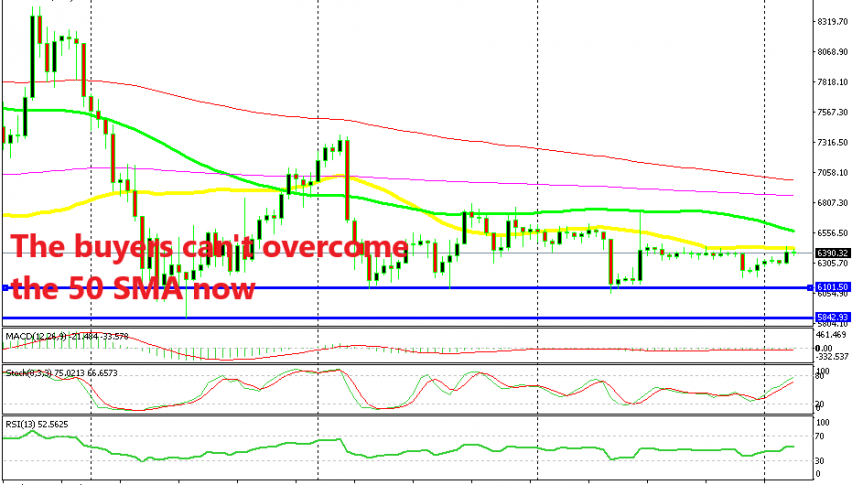
But once again, the decline stopped at the support area above $6,000. The area around $6,000 has been providing support throughout this year and it did so once again last week. It started reversing higher after failing to break below the support area and yesterday Bitcoin jumped around $150 up to the top.
The cryptocurrency market remains open during the weekend as well if you are in doubt. So, Bitcoin moved higher again from the support area but the climb stopped at the 50 SMA (yellow) on the daily chart.
As you can see from the daily chart above, it used to be the 100 SMA (green) which was providing support until the middle of last month. Now, the 50 SMA has turned into resistance on this chart. This means that the buyers have been getting weaker.
But, that is easily observable by a quick glance, seeing that the highs have been getting lower. Now, the stochastic indicator is almost overbought, which means that the retrace is almost compete. Weill we see another bearish move after that? Will the support at $6,000 be broken?
This chart setup surely points at that scenario but, the support is also pretty strong, so I won’t sell Bitcoin right now. I will wait for the bearish move to complete again and if the support area holds again, then I might be tempted to go long for a few hundred Dollar.
- Check out our free forex signals
- Follow the top economic events on FX Leaders economic calendar
- Trade better, discover more Forex Trading Strategies
- Open a FREE Trading Account


