Stocks Make A Bullish Engulfing Pattern on the Weekly Chart
Stock markets have declined for weeks, but last week they formed a bullish engulfing pattern.

Stock markets have been declining in the last several weeks as market sentiment deteriorated. Brexit, Italian budget and the US midterm elections are the main reasons for this shift in the sentient, but today one of these issues is going to be revealed. The US elections will begin soon because it is still pretty early in the US at the moment.
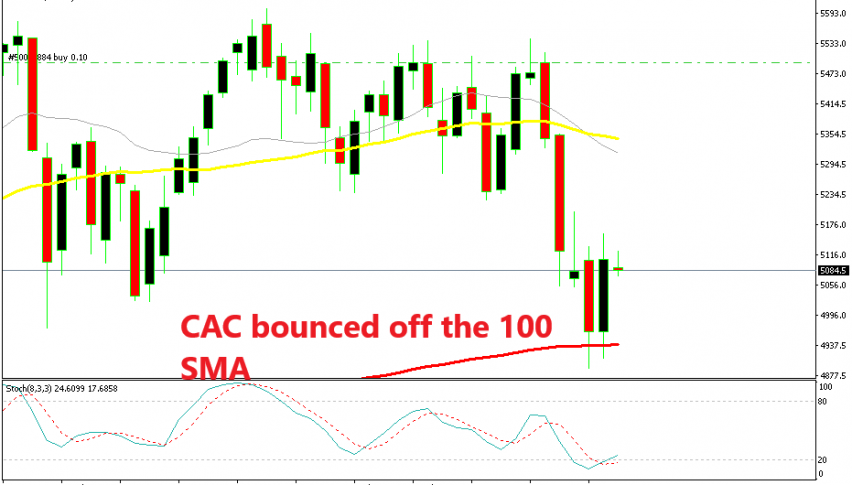
Last week though, we saw a turnaround in stock markets, although I’m not sure at this moment if this is a real reversal or whether it was just a retrace of the last several weeks. But, the weekly chart shows a bullish reversal pattern which is the bullish engulfing candlestick.
The bullish engulfing pattern consists of a smaller bearish candle in the previous week, followed by a bigger bullish candlestick the week after. Last week’s candlestick is bigger than the previous one, especially if we include the wicks as well. Besides that, the stochastic indicator is also overbought and turning higher, while the 100 SMA (red) provided solid support. This does look like a bullish reversing pattern.

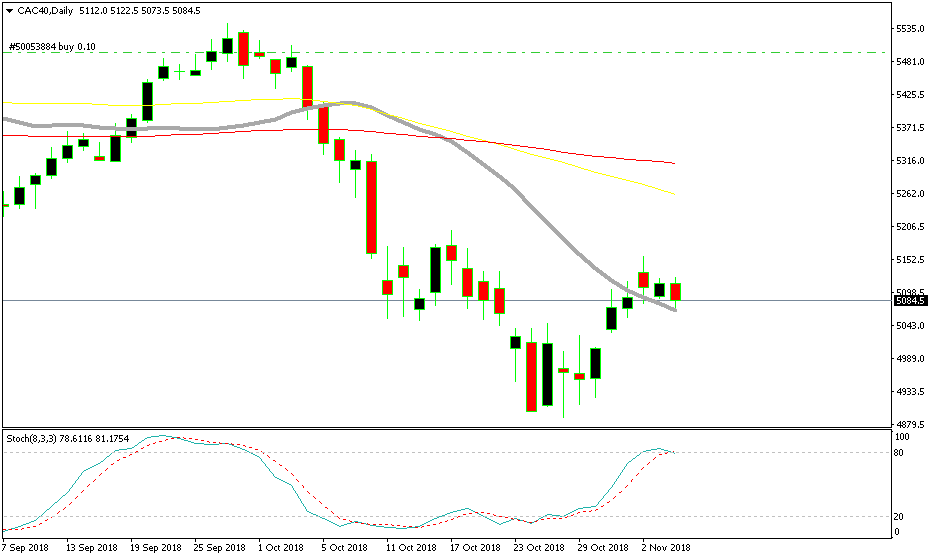
The D1 chart is overbought but the 20 SMA is providing support
But if we switch to the H1 chart, we see that CAC is overbought here and slipping lower in the last few days. But, the 200 SMA (grey) is now providing support. If the sellers fail to push below the 20 SMA, then it won’t matter if the price is overbought, the buyers might decide to push higher based on the weekly chart.
But, the market sentiment remains the driving force behind stocks. Although, if the US exit poll results start coming out and Republicans lead for the congressional seats, then we might see a quick and ferocious rally for some time in stocks as a relief rally after falling for weeks, so keep an eye on the US elections. We will update during the day.
- Check out our free forex signals
- Follow the top economic events on FX Leaders economic calendar
- Trade better, discover more Forex Trading Strategies
- Open a FREE Trading Account


