Bitcoin Buyers Break the 50 SMA but Give up at the 100 SMA
Bitcoin has climbed up in the last two weeks and broke the 50 SMA. But seems like it is about to reverse back down now.
Bitcoin has been trading on a bearish trend this year, but the area around the $6,000 level has turned into a solid support area with a $200 buffer zone above and below it, as you can see from the Bitcoin daily chart above. About two weeks ago, we saw the latest assault on that support area from the sellers, but once again, they failed to break below it.
That discouraged the sellers and eventually Bitcoin reversed higher. In the last two weeks, Bitcoin has been climbing higher, albeit slowly. At first, it found resistance at the 50 SMA (yellow). The 50 SMA has turned into resistance since the middle of October and it has capped Bitcoin for about a month.
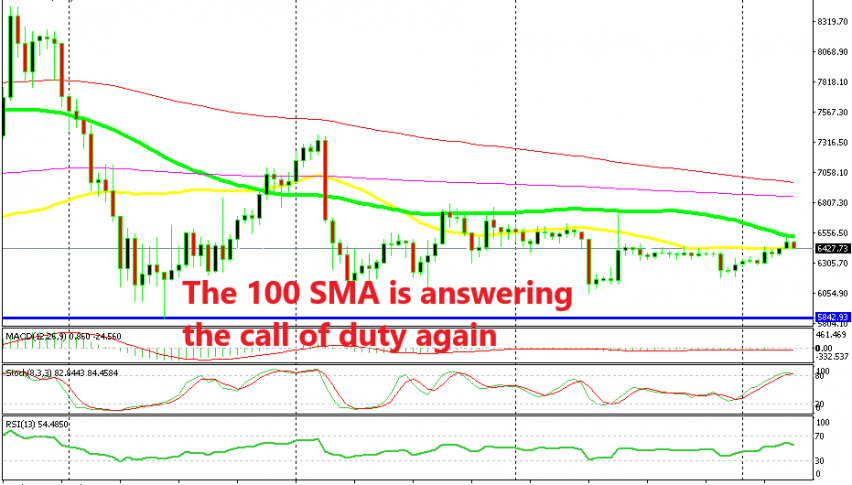
But, that moving average was broken yesterday and Bitcoin moved about $80 higher. But, the 100 SMA (green) proved a bit too much for buyers this time. It also worked as resistance from late September until the middle of October, so now it is doing that job again.
This might actually be a good chance to open a small sell trade in Bitcoin. The stochastic indicator is overbought on the daily chart, which means that the retrace higher is complete. Today, Bitcoin has already started to slip lower, which seems like the beginning of a bearish reversal.
So if you are selling, please place the stop above the 100 SMA and the TP target should be somewhere around $6,200.
- Check out our free forex signals
- Follow the top economic events on FX Leaders economic calendar
- Trade better, discover more Forex Trading Strategies
- Open a FREE Trading Account