AUD/USD Trying to Break Above the 100 SMA on the Daily Chart
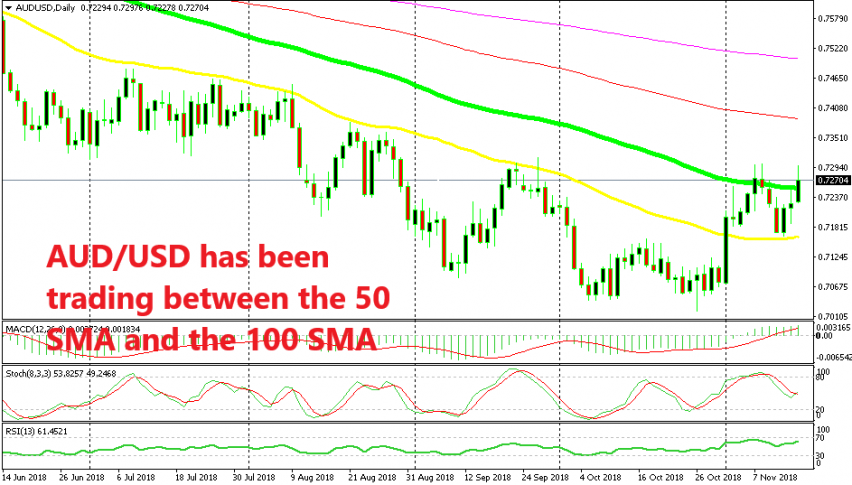
AUD/USD has ratreced on this downtrend and has broken the 50 SMA. Now, it is threatening the 100 SMA which would really threaten the trend.

[[AUD/USD]] has been trading on a bearish trend throughout this year which has been pretty straightforward. The 50 SMA (yellow) has done a really god job in setting the trend and providing resistance on every bullish retrace during this year.
But, that moving average broke on the first day of November before the US midterm elections as forex traders adjusted their positions just in case there was a major stirrup in US politics. Nothing major changed in US, but that last minute move before the elections was enough to break the 50 SMA. The daily candlestick closed above it so the break was complete.
So, the downtrend has been in jeopardy in the last two weeks and it still is under attack. The 100 SMA (green) provided resistance last week despite being pierced a couple of times. So, the price returned down and the sellers tried to resume the downtrend, but the 50 SMA now turned into support.
Then the price reversed back up again in the last few days as the sentiment turned against the USD on the Brexit deal. Now, the buyers are trying to break above the 100 SMA once again and the price is already above it at the moment. But, we might see a reversal and a close below it. The price did return below the 100 SMA today after breaking above it briefly.
So, we will see what AUD traders have decided when the daily candlestick closes tonight. The employment report early in the Asian session today was pretty positive, so the fundamentals are positive for the AUD at the moment. It’s for this reason that we have to wait until the day ends.
If the 100 SMA is broken, then it means that the trend is reversing, or at least, we are seeing a decent pullback. In that case, the 100 SMA would be a good place to look for longs if AUD/USD retries it from the upside.
- Check out our free forex signals
- Follow the top economic events on FX Leaders economic calendar
- Trade better, discover more Forex Trading Strategies
- Open a FREE Trading Account


